How to use MapTrack3D plugin

Hello the Community,

I am not an IT guy … not at all. It’s for me really complicated to understand … however, I want to try. But, I need help.

I just want to create a “Spider Map” representing flights I did and future flights.

Same or similar as the Company “GLOBEAIR” do (ou can see pictures by searching in Google for “Flights Spider Map” of directly on this link : https://twitter.com/GlobeAir/status/1478328211918442497)

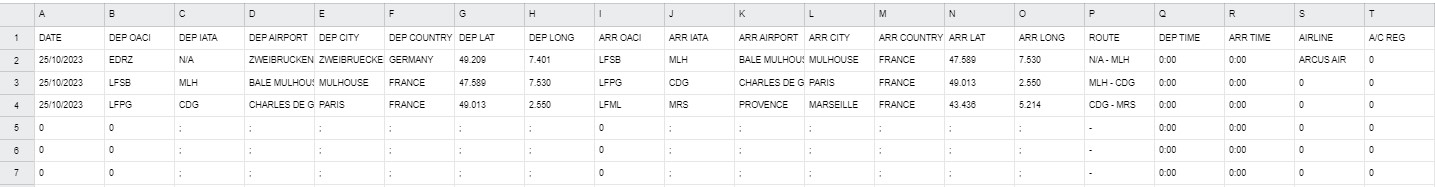
For that, I have created an Excel File to save all my data.

Then, I can export those data in a CSV file. I can convert this CSV into a MySQL too (online website which can create a code).

In Grafana, I added the PlugIn MapTrack3D.

I created a DASHBOARD, using this plugin, for the Visualization.

The problem I am facing now is to create a DATASOURCE, to give to this DASHBOARD.

I absolutely do not know how to do.

In the Dashboard, I selected MySQL in the Data source filed.

Then, on the right, just on the right of “> Run query”, I selected “Code”.

Then, I copy/paste the MySQL code given by website

But I got the following error message :

db query error: failed to connect to server - please inspect Grafana server log for details

For info, my data is “local”. I do not have any Database on internet or a website (no URL etc …)

I am blocked … thanks for your help or advices to do it more simple ! :wink:

To make it simple :

I have an EXCEL file with table/data … and I want to create a Spider Map with these data.

These data will increase, day after day so I want to be able to update the spider map easily, with the new data.

MANY THANKS in advance for your support.

Best regards,

Alexis

welcome @alexisaero

For a quick and dirty method do the following

  1. Install the infinity plugin which will serve as your data source for csv data.
  2. Then in the dashboard add your csv data as inline data for now.
city,lat,lon,time,alt
New York,40.730610, -73.935242,2023-27-10 15:06:36,30000
Paris,48.864716, 2.349014,2023-27-10 15:06:36,30000
  1. This should give you this map
    image

Hello Yosiasz,
Many thanks for your quick reply and good advices. I did it and now able to load a local file (CSV).
However, I do not get any vizualisation, even with my data or the one you gave me in your reply.
My data is probably not well defined (separator etc …) ; I do not know.
(I have seen that in the “Parsing options & Result fields”, we can change the Delimiter type).

I do not know what is wrong, as it should at least work with your data “New York, Paris”.

For info, here is my CSV content. May be you can check if everything is fine.

DATE,DEP OACI,DEP IATA,DEP AIRPORT,DEP CITY,DEP COUNTRY,DEP LAT,DEP LONG,ARR OACI,ARR IATA,ARR AIRPORT,ARR CITY,ARR COUNTRY,ARR LAT,ARR LONG,ROUTE,DEP TIME,ARR TIME,AIRLINE,A/C REG,;,
25/10/2023,EDRZ,N/A,ZWEIBRUCKEN,ZWEIBRUECKEN,GERMANY,49.209,7.401,LFSB,MLH,BALE MULHOUSE,MULHOUSE,FRANCE,47.589,7.530,N/A - MLH,0:00,0:00,ARCUS AIR,0,;,
25/10/2023,LFSB,MLH,BALE MULHOUSE,MULHOUSE,FRANCE,47.589,7.530,LFPG,CDG,CHARLES DE GAULLE,PARIS,FRANCE,49.013,2.550,MLH - CDG,0:00,0:00,0,0,;,
25/10/2023,LFPG,CDG,CHARLES DE GAULLE,PARIS,FRANCE,49.013,2.550,LFML,MRS,PROVENCE,MARSEILLE,FRANCE,43.436,5.214,CDG - MRS,0:00,0:00,0,0,;,
0,0,;,;,;,;,;,;,0,;,;,;,;,;,;,-,0:00,0:00,0,0,;,

The table looks like this

I just have to understand the philosphy … :wink:

Thanks and regards,
Alexis

Send a screen capture of this map using my sample data

Finally it works, but I do not know what I did for that.
Now I have to find a solution for my table, my data, how to collect only the relevant things in a big table for the expected result and why it doesn’t work for the moment.

Do you know if it’s possible to have different types of maps, as for example, the followings

Once again, I really appreciate your kind support and for the time you use for me.

Kind regards,
Alexis

The expected result in not the same.
I want to draw a line between two points : 1 flight = 1 departure and 1 arrival.

DEP LAT / DEP LON
ARR LAT / ARR LON

But I do not know if this is possible with this plugin.

The black picture looks like the map available in the plugin GEOMAP.

Look at the column names of my data vs yours.

Also take a look at the right side of the configuration where those column names are used

You cqn use geomap indeed with the Route (beta) option

Yes, checked and understood that the syntax is very important (of course !). Thanks.
I wanted to do it, using the Route in Geomap but this option is not available in the menu. Is theresomething special to do ?

Here below a picture showing what I was able to do. Thanks to you.
But as you can see, the image quality is not “good enough” with the MapTrack3D visualization. That’s why I want to do it with Geomap.
And I would like to have a point at each extremity of the lines, points showing the related info (e.g. Aiport name, and/or city and/or date, …).

Might want to read the docos

Dear Yosiasz,

I started to do it, changing my Data file in order to have the requested info for Nodes and Edges.
Unfortunately, either the ROUTE (Beta) or the NETWORK (Beta) options are not available.

On my side, only the following LAYER TYPE are visible in the Menu :

  • Markers
  • Heatmap
  • GeoJSON
  • Night / Day
  • Open Street Map
  • CARTO Basemap
  • ArcGIS MapServer
  • XYZ Tile Layer

For information, my Grafana version is v10.0.0 (81d85ce802)

Any suggestion ?

Maybe use the new Spatial Transformation

Hi Yosiasz,

Sorry for my late reply.
Many thanks for all your kind and efficient advices. I appreciate a lot and you are really helpful.

Best regards,
Alexis

1 Like