How to shift date of data and how to set per-graph time range?

Hello everyone :slight_smile:
I am new to Grafana and am loving it so far. Relatively easy to use and get into and looks great.

There are two small issues I am facing.

  1. How can I shift the data by -24 hours? I have data which is being reported as “consumption yesterday”, so effectively I am seeing the power consumption of the previous day (this makes sense because live daily consumption is not much good given that you won’t have all values until midnight). I now want to shift the data so it is shown on the correct day.
    Data shown on Tuesday is Mondays data and so on.

  2. When I define the time range of a graph, this is also applied to all other graphs. I would like to have daily graphs, weekly graphs etc. Is it possible to define the time range on a per-graph basis?

Thank you all for your feedback :slight_smile:
Alex

1 Like
  1. How can I shift the data by -24 hours? I have data which is being
    reported as “consumption yesterday”, so effectively I am seeing the power
    consumption of the previous day (this makes sense because live daily
    consumption is not much good given that you won’t have all values until
    midnight). I now want to shift the data so it is shown on the correct day.
    Data shown on Tuesday is Mondays data and so on.

Please show us the query you’re using and show us a sample of the data in your
data store which contains the daily values.

  1. When I define the time range of a graph, this is also applied to all
    other graphs. I would like to have daily graphs, weekly graphs etc. Is it
    possible to define the time range on a per-graph basis?

Yes, you can set “Relative Time” and “Time Shift” indivudally per panel.

See Query and transform data | Grafana documentation and
Use dashboards | Grafana documentation

Antony.

1 Like

Thank you for your feedback, @pooh

I have a fresh setup, so not really much data.

Essentially it is right now
X1 = 07.06.2021
Y1 = 0.456 kWh
X2 = 08.06.2021
Y2 = 0.656 kWh
…
but in reality, X1 should be 06.06.2021 and X2 should be 07.06.2021 because the value is yesterday’s value. So date of recording is today but date of origin is yesterday.

I think there is a misunderstanding, maybe. Time shift and relative time do not define the x-axis range to display.
So, let’s say I want to see Monday - Sunday on one graph but I want to see the last 24 hours on another graph. How to I define these two x-axis time ranges for the two graphs?

I have a fresh setup, so not really much data.

Essentially it is right now
X1 = 07.06.2021
Y1 = 0.456 kWh
X2 = 08.06.2021
Y2 = 0.656 kWh
…
but in reality, X1 should be 06.06.2021 and X2 should be 07.06.2021 because
the value is yesterday’s value. So date of recording is today but date of
origin is yesterday.

I would very much recommend that you fix the source of data so that it puts
correct datestamps for each value into your data store. I can’t recommend how
to do this in detail without knowing what language your script for collecting
this data and putting it into your data store is written in, but basically you
want to do some equivalent of “subtract_date(today, 1 day)” before putting the
datestamp into your data store.

Yes, you can set “Relative Time” and “Time Shift” indivudally per panel.

See Query and transform data | Grafana documentation
and
Use dashboards | Grafana documentation

I think there is a misunderstanding, maybe. Time shift and relative time do
not define the x-axis range to display.

Um, yes they do?

So, let’s say I want to see Monday - Sunday on one graph but I want to see
the last 24 hours on another graph. How to I define these two x-axis time
ranges for the two graphs?

“Monday to Sunday” is not clear to me. Do you mean “the current week” or
perhaps “the previous week”? Or maybe something else?

You cannot get Grafana to display a composite of all weeks’ data overlaid on
one another, just in case that is what you meant.

Assuming you’d like one graph to show the previous day, and another graph to
show the previous week, I think you would use:

  1. Relative time = now/d, Time shift = 1d/d

  2. Relative time = now/w, Time shift = 1w/w

Quoting from Query and transform data | Grafana documentation
#query-options :

"Relative time - You can override the relative time range for individual
panels, causing them to be different than what is selected in the dashboard
time picker in the top right corner of the dashboard. This allows you to show
metrics from different time periods or days on the same dashboard.

"Time shift - The time shift function is another way to override the time
range for individual panels. It only works with relative time ranges and
allows you to adjust the time range.

“For example, you could shift the time range for the panel to be two hours
earlier than the dashboard time picker. For more information, refer to Time
range controls.”

I hope that helps,

Antony.

2 Likes

Hello @pooh

I would very much recommend that you fix the source of data

The input data is supplied by a sensor. So the sensor tells me how much power was consumed the previous day. I want to use this available data. There is no fixing it because the sensor itself is “energy yesterday”.

“Monday to Sunday” is not clear to me.

Instead of Relative Time 14 days (which on a Wednesday would show Thursday two weeks ago until today, Weddesday) I want to see calendar weeks. So always Monday until Sunday, where each future day of the week would be empty. So I would see last week Monday until this week Sunday.

Thank you again for your help! :slight_smile:
Alex

1 Like

Hello @pooh

I would very much recommend that you fix the source of data

The input data is supplied by a sensor. So the sensor tells me how much
power was consumed the previous day. I want to use this available data.
There is no fixing it because the sensor itself is “energy yesterday”.

So, what’s the full path for the flow of data between sensor and your data
store (and for that matter, what are you using as your data store)?

“Monday to Sunday” is not clear to me.

Instead of Relative Time 14 days (which on a Wednesday would show Thursday
two weeks ago until today, Weddesday) I want to see calendar weeks. So
always Monday until Sunday, where each future day of the week would be
empty. So I would see last week Monday until this week Sunday.

In that case I think this “this week” should fit what you want for that.

Antony.

Oh, I think you meant two weeks, not just one, and there isn’t anything
obviously labelled “current fortnight” :slight_smile:

Time range controls | Grafana Labs should
point you in the right direction, though - try “now-2w/w” and “now/w”.

Antony.

So, what’s the full path for the flow of data between sensor and your data
store (and for that matter, what are you using as your data store)?

Sensor → MQTT → Home Assistant → InfluxDB → Grafana

Oh, I think you meant two weeks, not just one, and there isn’t anything
obviously labelled “current fortnight” :slight_smile:

Time range controls | Grafana Labs should
point you in the right direction, though - try “now-2w/w” and “now/w”

This is why this is tricky.
Today is Wednesday, 09.06.2021.
So “now-2w/w” would show 24.05.2021 - 09.06.2021. So it is the same as selecting simply 2w = last 14 days.

But what I want is 31.05.2021 - 13.06.2021, which is Monday 31.05. until Sunday 13.06. This equals two full calendar weeks.
So the formula would need to be something like “last week Monday until this week Sunday”.

And I want to do the same for daily views. I don’t want to see the last 24 hours, I want to see from 00:00 o’clock until 23:59 o’clock, so one full calendar day.

Sensor → MQTT → Home Assistant → InfluxDB → Grafana

I’m not familiar with Home Assistant, but does it have any data manipulation
functions which would enable you to subtract one day from date on the way
between MQTT and InfluxDB?

Oh, I think you meant two weeks, not just one, and there isn’t anything
obviously labelled “current fortnight” :slight_smile:

Use dashboards | Grafana documentation
should point you in the right direction, though - try “now-2w/w” and
“now/w”

This is why this is tricky.
Today is Wednesday, 09.06.2021.
So “now-2w/w” would show 24.05.2021 - 09.06.2021. So it is the same as
selecting simply 2w = last 14 days.

No, that is not what the “/w” on the end of “now/w” means.

And I want to do the same for daily views. I don’t want to see the last 24
hours, I want to see from 00:00 o’clock until 23:59 o’clock, so one full
calendar day.

Look at the link I posted above.

Note the difference between “This week” and “This week so far”, and between
“This month” and “This month so far”.

You want the versions without “so far” in them.

Antony.

I must have somehow messed up because I tried “now-2w/w” and it gave the wrong result. Or rather I thought I had applied “now-2w/w”!
I tried again and it worked, thank you!

One question, because I seemingly can’t find it.
How do it use “Relative Time” for “From” “To”? I see that I can do this for absolute time at the top of the panel but this is then applied to all panels.
Relative time only seems to allow one statement, which would be e.g. “now-2w/w” but then it ends today.
I wanted to try “From:now-2w/w To:now/w” but it does not work.

I’m not familiar with Home Assistant, but does it have any data manipulation
functions which would enable you to subtract one day from date on the way
between MQTT and InfluxDB?

It should be possible, yes, but this would mean that I have to create a new sensor for each senor I own. This new sensor would then be a manipulated version of the original.
This would create a lot of additional sensors that I don’t really want.
If Grafana allowed me to simply shift the data, then I could cone the graph and use it for the different, already existing sensors.

1 Like

Maybe it is not relevant anymore and/or I have missede something about the question, but I would use |> timeShift(duration:-1d) in the Flux query.

https://docs.influxdata.com/influxdb/v2.0/reference/flux/stdlib/built-in/transformations/timeshift/

Hi, you also have a look at the shift-selector panel plugin

You should set “line interpolation” to “step before”.

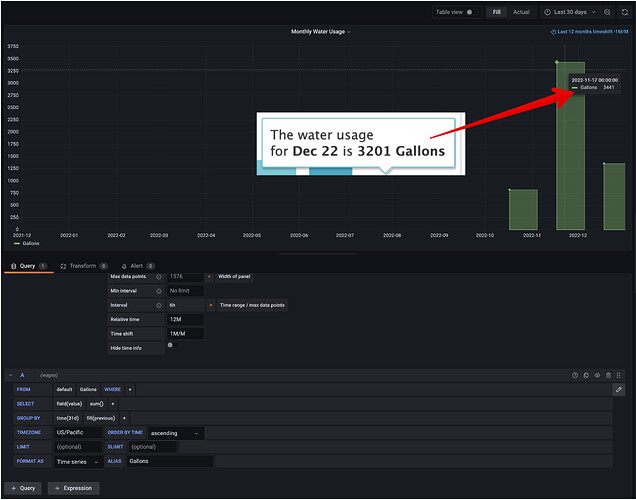
I’m trying to shift the date of my panel and display yesterday-7d and show daily sum of water usage. At first I was unable to get the daily sum to display correctly. Then after I put in my time zone it correctly display the data:

However, when trying to make a similar panel to show monthly data for last 12 months, the data doesn’t appear to sum correctly as I can’t figure out how to limit the:

How can I get this chart to sum all of the values in a calendar month? And does the Group By field have a way to be set to a calendar month instead of 30d or 31d?

@poldim I see you are using InfluxQL. If you are willing to move to Flux, this should become much easier (incl. your question about 30 vs 31 days, which Flux handles nicely).

To illustrate, I collected my kWh every hour from January thru August (8 months, or 243 days).

Here is the data by hour (5832 points on the graph, or 243 x 24)

Here is the data by day (243 points on the graph)

Here is the data by month (8 points on the graph):

Note that I am aggregating the data differently in each of the above. I am using the fn: mean to collect the arithmetic average of the hourly values collected (the average of 24 readings in the 1d aggregateWindow, and the average of all hourly readings during the month in the 1mo aggregateWindow).

Thanks for the response grant. Does Flux require influxdb v2? If I understand correctly, that would be a sizable project for me to move everything to v2 and figure out how to update my python scripts to work with v2.

I think Flux will work with v1.8 and up, but of course v1.8 is pretty old by now (the current version is v2.6).

You may eventually be forced to migrate your data (and give up InfluxQL). I personally did not find it that difficult, and Flux is way more flexible, esp. to do complex things.

How many Python scripts do you have? Could you set up a test InfluxDB (with Flux) just to play around with?