Hello Grafanities,
I am new to Grafana and using v7.0.0.
My question is how I can scale my X-Axis as per my source data. Below, I have created a sample data and panel visualization to describe my problem statement.
Data:

Panel Dashboard:
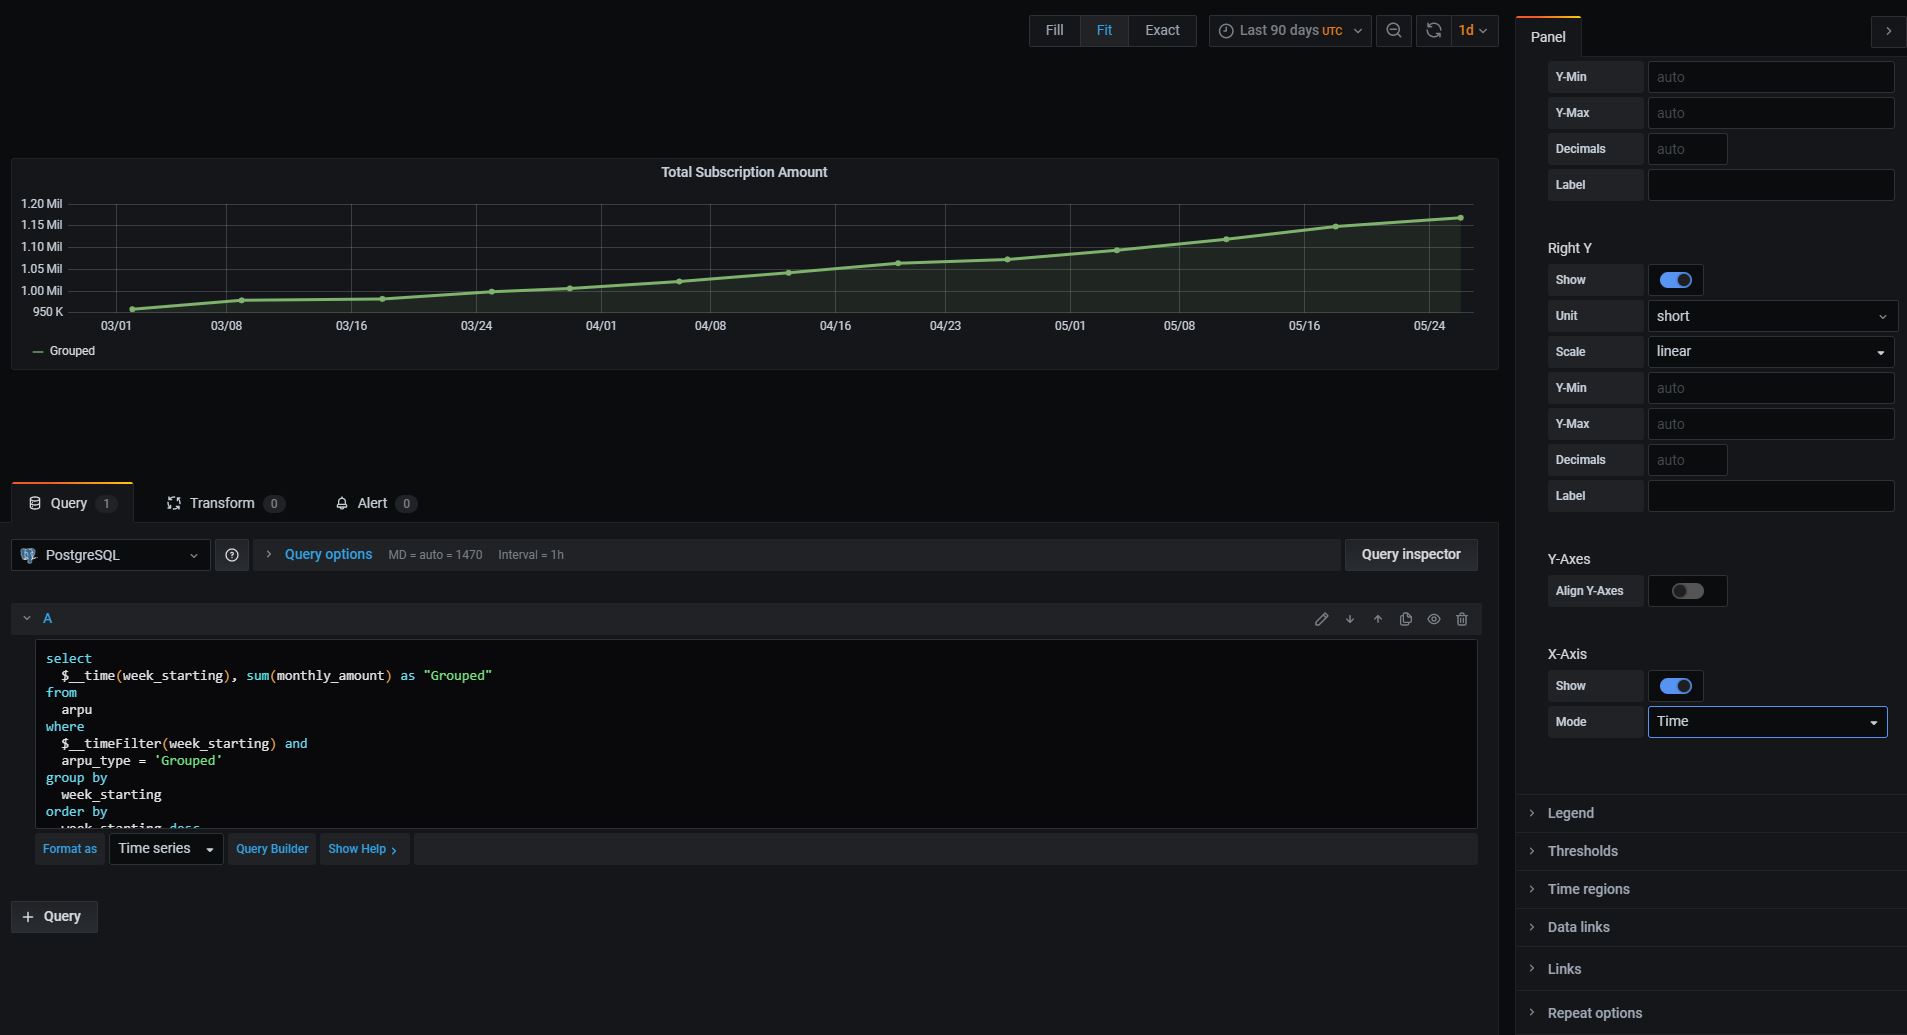
I selected absolute time range of 90 days. The auto X Axis scale is synchronous or scaled with 7 days interval. How can I change the existing interval?
Or, how can I set the X Axis scale based on my time data($__time(week_starting)) or based on a column data of my data source.
Please help!
Regards,
Sudeep