I could see that the x-axis is always displayed on the website I provided as an example.
Seeing this, I thought it could be fixed.
Do you happen to know how to maintain it like this?
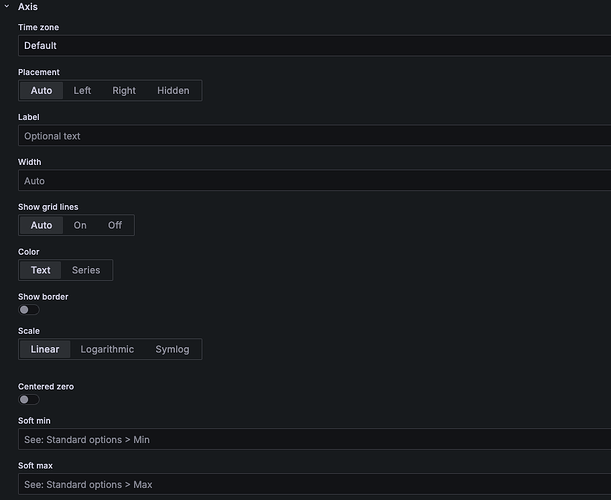
I’m attaching a screenshot of the screen I’m looking at.

{
  "datasource": {
    "type": "graphite",
    "uid": "000000001"
  },
  "description": "",
  "fieldConfig": {
    "defaults": {
      "custom": {
        "drawStyle": "line",
        "lineInterpolation": "smooth",
        "barAlignment": 0,
        "lineWidth": 2,
        "fillOpacity": 40,
        "gradientMode": "opacity",
        "spanNulls": true,
        "insertNulls": false,
        "showPoints": "never",
        "pointSize": 5,
        "stacking": {
          "mode": "none",
          "group": "A"
        },
        "axisPlacement": "auto",
        "axisLabel": "",
        "axisColorMode": "text",
        "axisBorderShow": false,
        "scaleDistribution": {
          "type": "linear"
        },
        "axisCenteredZero": false,
        "hideFrom": {
          "tooltip": false,
          "viz": false,
          "legend": false,
          "graph": false
        },
        "thresholdsStyle": {
          "mode": "off"
        }
      },
      "color": {
        "mode": "palette-classic"
      },
      "mappings": [],
      "thresholds": {
        "mode": "absolute",
        "steps": [
          {
            "color": "green",
            "value": null
          },
          {
            "color": "red",
            "value": 80
          }
        ]
      },
      "unit": "short"
    },
    "overrides": [
      {
        "matcher": {
          "id": "byName",
          "options": "backend_01"
        },
        "properties": [
          {
            "id": "color",
            "value": {
              "fixedColor": "purple",
              "mode": "palette-classic"
            }
          }
        ]
      },
      {
        "matcher": {
          "id": "byName",
          "options": "backend_02"
        },
        "properties": [
          {
            "id": "color",
            "value": {
              "fixedColor": "green",
              "mode": "palette-classic"
            }
          }
        ]
      },
      {
        "matcher": {
          "id": "byName",
          "options": "backend_02"
        },
        "properties": [
          {
            "id": "color",
            "value": {
              "fixedColor": "blue",
              "mode": "fixed"
            }
          }
        ]
      },
      {
        "matcher": {
          "id": "byName",
          "options": "web_server_01"
        },
        "properties": [
          {
            "id": "color",
            "value": {
              "fixedColor": "#EF843C",
              "mode": "fixed"
            }
          }
        ]
      },
      {
        "matcher": {
          "id": "byName",
          "options": "web_server_02"
        },
        "properties": [
          {
            "id": "color",
            "value": {
              "fixedColor": "#EAB839",
              "mode": "fixed"
            }
          }
        ]
      },
      {
        "matcher": {
          "id": "byName",
          "options": "web_server_03"
        },
        "properties": [
          {
            "id": "color",
            "value": {
              "fixedColor": "#508642",
              "mode": "fixed"
            }
          }
        ]
      },
      {
        "matcher": {
          "id": "byName",
          "options": "web_server_04"
        },
        "properties": [
          {
            "id": "color",
            "value": {
              "fixedColor": "#E24D42",
              "mode": "fixed"
            }
          }
        ]
      }
    ]
  },
  "gridPos": {
    "h": 7,
    "w": 18,
    "x": 0,
    "y": 2
  },
  "id": 1,
  "maxDataPoints": 400,
  "options": {
    "tooltip": {
      "mode": "multi",
      "sort": "none"
    },
    "legend": {
      "showLegend": true,
      "displayMode": "list",
      "placement": "right",
      "calcs": []
    }
  },
  "pluginVersion": "8.0.0-beta1",
  "targets": [
    {
      "datasource": {
        "type": "graphite",
        "uid": "000000001"
      },
      "refCount": 0,
      "refId": "A",
      "target": "aliasByNode(scaleToSeconds(apps.backend.backend_01.counters.requests.count, 1), 2)",
      "textEditor": false
    },
    {
      "datasource": {
        "type": "graphite",
        "uid": "000000001"
      },
      "hide": false,
      "refCount": 0,
      "refId": "B",
      "target": "aliasByNode(scaleToSeconds(apps.backend.backend_02.counters.requests.count, 2), 2)"
    }
  ],
  "title": "Simple graph",
  "type": "timeseries"
}


