I have configured a PostgreSQL data source. However, I am unable to query data from it. There is no table available to select, why?
Please note that I have tables in separate schemas, eg:
Schema 1 → Table 1, Table 2, etc.
Schema 2 → Table 3, Table 4, etc.

Check this out
Thanks, but that did not work. I am not even getting suggestion in the code option.
it seems like a bug but until then just switch to code and type out your query.
the suggestion is just that, just a small helper.
I get error message while I try to write code. How to define the schema in code? I think this is why I can get the tables?
do you use any querying tool against your postgres db? like pgql?
Tell us what the error message is.
Antony.

run the same query that fails in grafana, using dbeaver
What does the result look like in dbbeaver? Please share screen grab if dbbeaver results
Hi @usrcosmicglow,
It worked because as you probably have searched and discovered that you’ll need to use the format “my_schema”.“my_table” to query a specific schema on Postgresql.
Repeat with me for the sake of your future: “I’ll never do a ‘SELECT * FROM some_table’ again”
Grafana in general tries to help you but it’s better to set the columns that you need. Please don’t use a select all statement, or you’ll get that multi-series of the image depending on the format of your table data.
If you need a histogram you’ll need a set with “time, metric, value” columns as the example bellow
SELECT my_time_column as "time",
    my_metric_label as "metric",
    my_metric_value as "value"
FROM my_table
If you don’t need a histogram, change the type of the query from “timeseries” to “table”. So you’ll don’t need a time column and grafana will not try to apply some histogram formating logic to it.
I wish you good studies.
I have since changed my code and selected custom columns, but the previous problem is still there. The Grafana Query name is missing in the output. How do I ensure that the query name is Present?
Updated code:
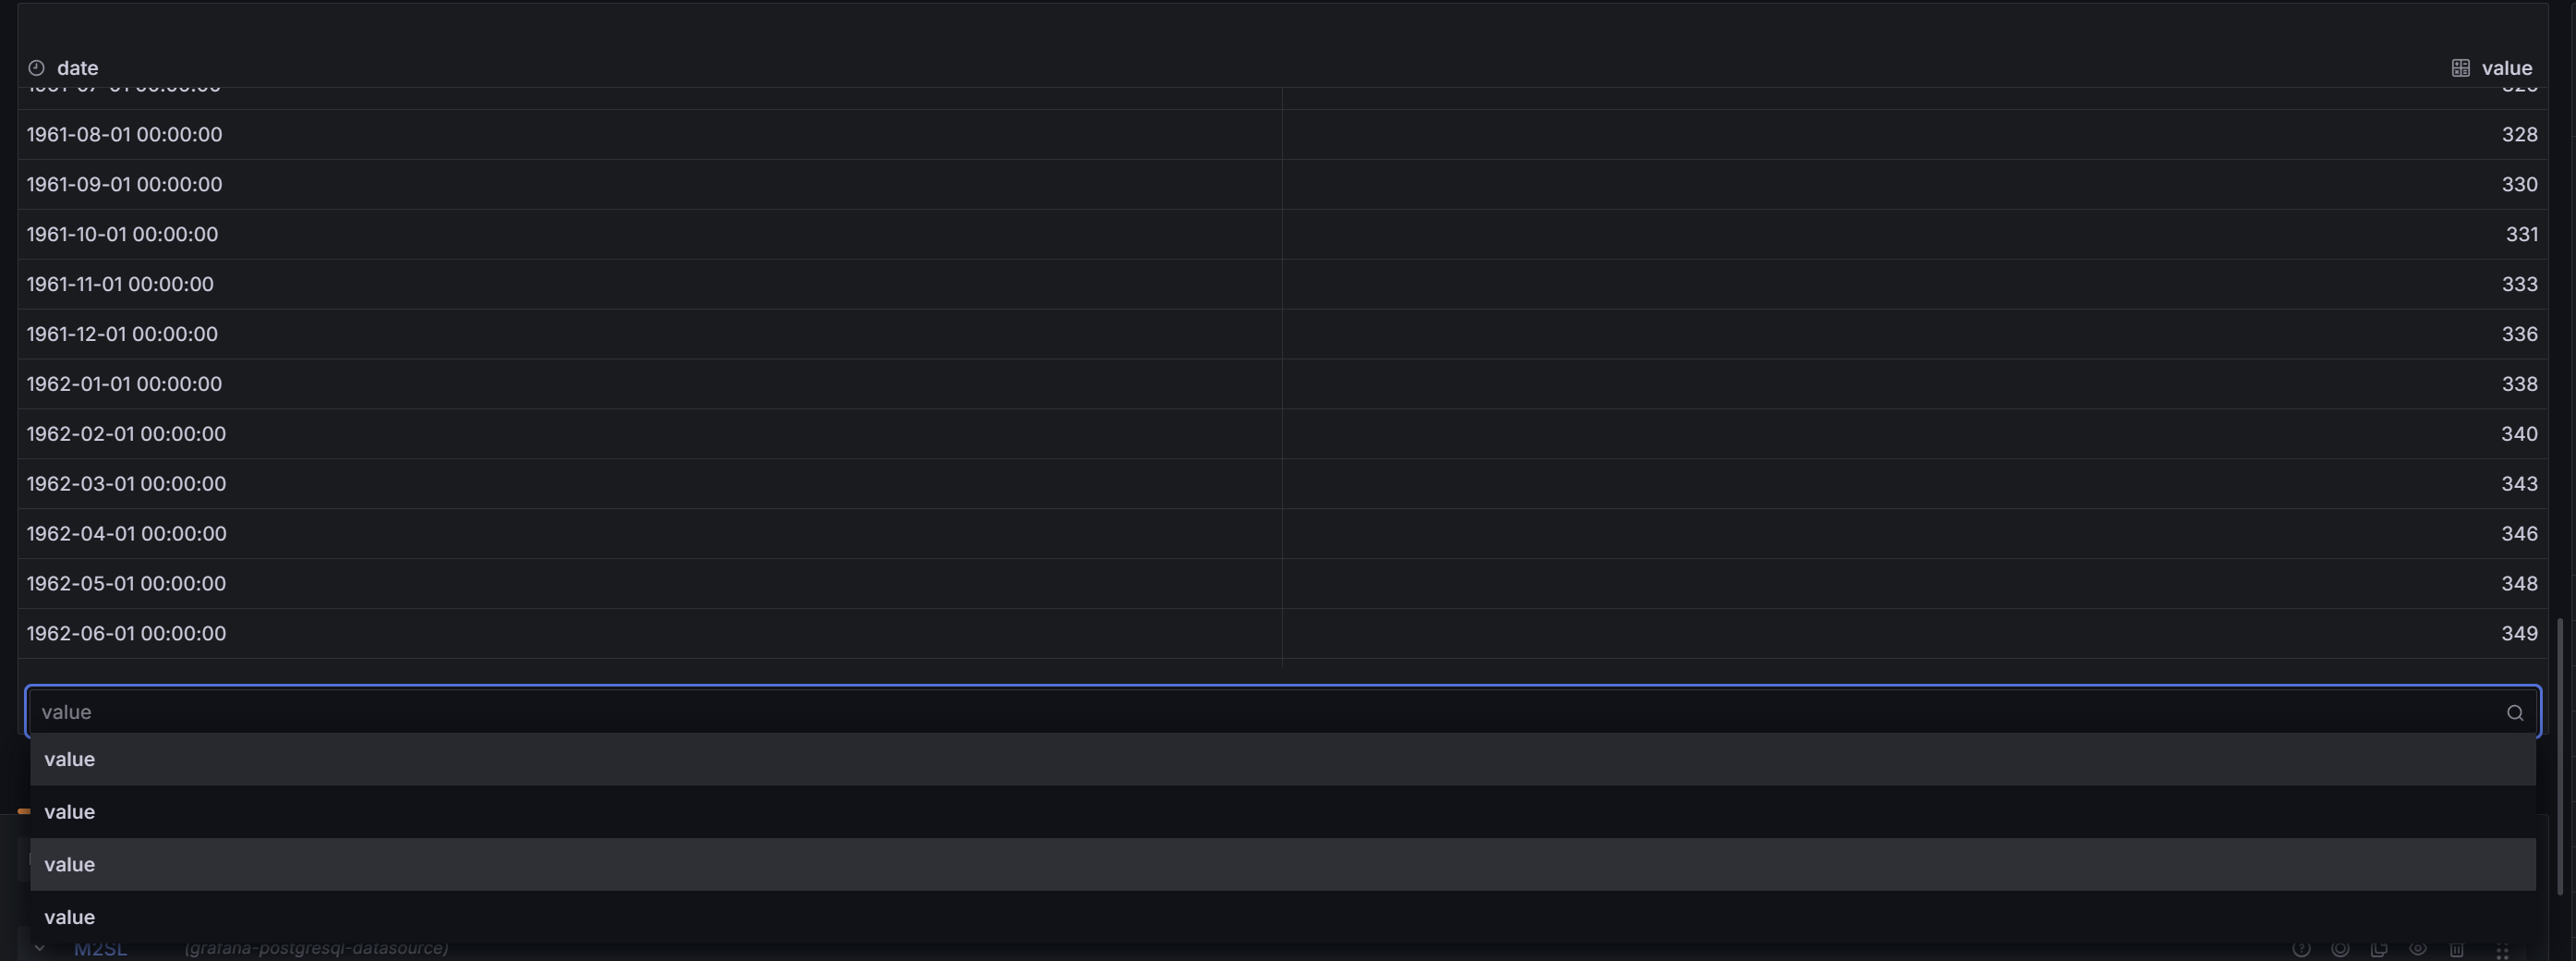
In Grafana, the table name is shown as the last column header, so the Query name is missing as I explained above.
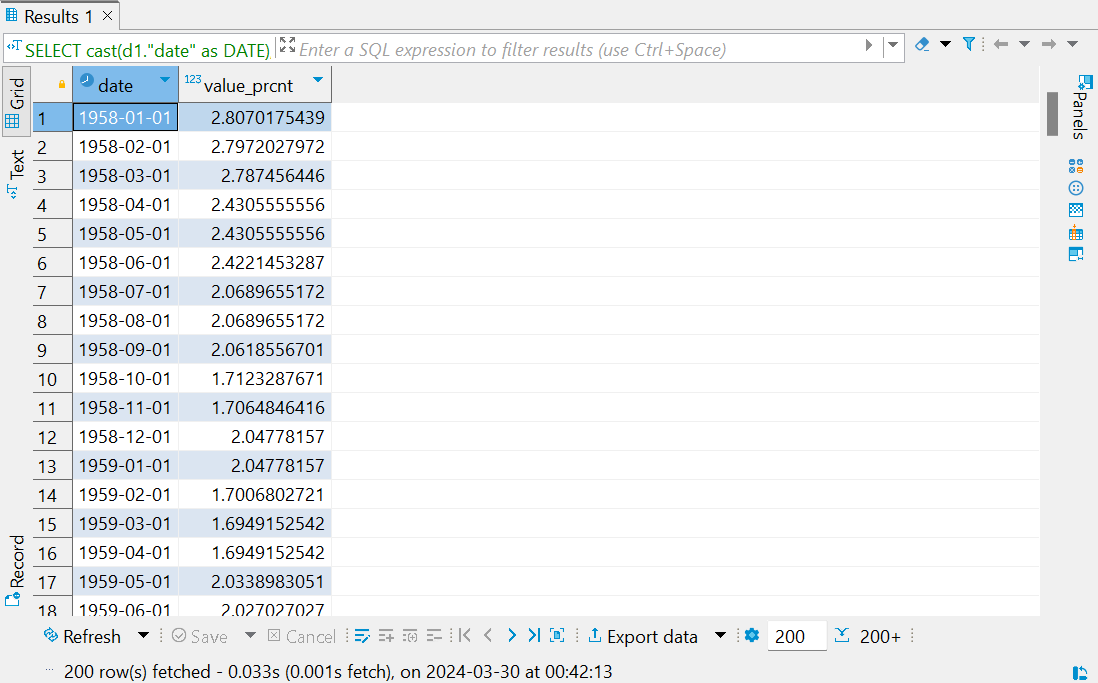
I was asking for you to show us what the original query
SELECT * FROM macros."DFF" looks like in dbbeaver
Similar to the one above, except “value” as the header in the 2nd column. I’m away from the computer so unable to attach the screenshot here.
The issue is in Grafana, there is not query name associated with the data. So, each data query result is having a name “value”.
Try to use table format, not timeseries.

Can I please get some help in resolving this “Query name missing in the output” issue?
What is that? Is it an error?
Explained here - How to query from PostgreSQL data source? - #10 by usrcosmicglow