Hi guys! I’m very new to Grafana and trying to create a monitoring dashboard for an existing system which is Graylog based. I successfully configured the ElasticSearch datasource (ES 7.*) and able to create some of the graphs already but it seems I experience problems with plotting simple segmented data obtained in one query.
I have Jobs breakdown Pie chart which consists of 3 separate queries, not sure if its right or not, but I couldn’t find another way of visualizing 3 different metrics in one go, but in this case I know what to query for to get these metrics.
Problem starts here:
appName           | timestamp    | Count
standalone-client   | 1621454418002 | 1
standalone-clientoo | 1621453746887 | 1
standalone-client   | 1621434680736 | 1
standalone-client   | 1621363720159 | 1
standalone-clientoo | 1621359431020 | 1
standalone-client   | 1621359344413 | 1
standalone-client   | 1621359313162 | 1
standalone-clientoo | 1621356778894 | 1
standalone-client   | 1621356770769 | 1
standalone-client   | 1621351482056 | 1
I was able to get aggregated metric for each app (IDK how many app can be there and what they are) in the table above. Now I would like to plot it with pie chart (or any relevant type of graph to show the share between apps) but I faced few problems here.
When I use bar gauge I can’t make it show each appName with it’s correspondent Count sum - seems to be not the right data format or is it my bad? Then I tried it another way I grouped the data completely to an app-metric dataset below (not time based):
appName            | Count
standalone-client    | 10
standalone-clientoo  | 3
But here is another problem I can’t solve. Both bar gauge and pie chart don’t give expected result. Pie chart seems show the share between apps but for Count only whether I would like to see by-app breakdown in my case:

here I used All values option
Same goes for the bar gauge ![]()
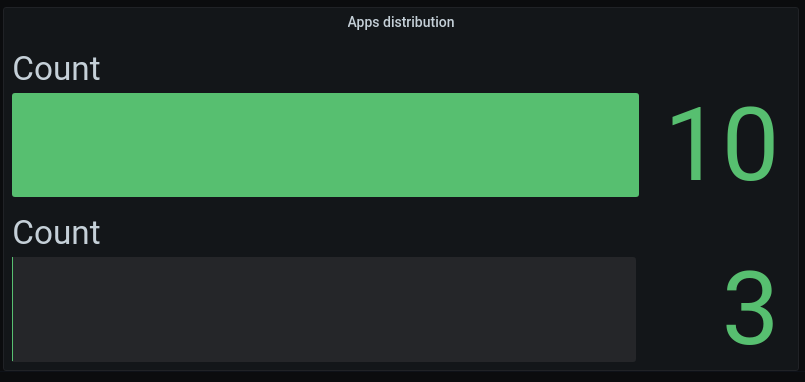
How can I change the Count to the corresponding appName field so that chart shows it in different colors as expected ![]()
I already tried such stuff like $__cell_0 in Field/Display Name etc but nothing seems to work for me. Maybe I’m missing smth. important here and they way I try to solve its not the intended one, but it still seems that this should be an easy task? I also find very little info on such cases with Grafana+ElasticSearch whether it seems to be easier to me with MySQL (more info at least).
Here is topic discussed for MySQL - Display names for bar gauge (Series[0]...).
Any help is much appreciated …