Hi,
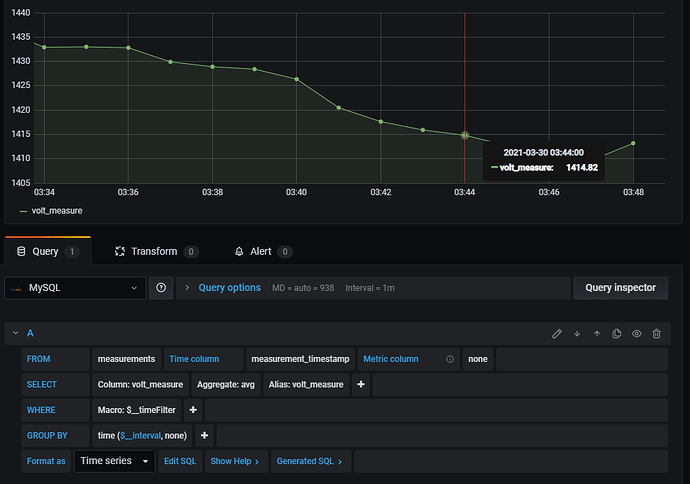
I’m having a big confusion about the query to make my data from MySQL to be plot in Grafana. Here is my setting in my server.
Database: MySQL
Column 1 : id (integer) but not auto-increment
Column 2 : timestamp (YYYY-MM-DD hh:mm:ss.000) 000 = milliseconds
Column 3 : volt_measure (integer)
Column 4 : volt_D (integer) – different value between previous and recent

I’m using timestamp format which perform by MySQL and try to plot it in graph but the problem is there is no function that I can use to plot by using my true value. In grafana just show only Aggregate which have only avg, count, min, max, sum, stddev and variance only. I don’t want my data to plot into avg, count, min …etc but with my true exact value.
i don’t know why my data become float and the timestamp become inaccurate. Somebody help me.
Do I need to do a custom writing query? or else?
