-
What Grafana version and what operating system are you using?
Grafana 12.0.2 and InfluxDB:2.7 -
What are you trying to achieve?
I am using InfluxDB for my data and I have a measurement that I want to show the mean of with an area of the min and max that’s generic and repeatable. Like this:
But instead of having ‘Max‘, ‘Value‘ and ‘Min‘ I want like one name in the legend that is coupled to the ‘Value‘ so that I am able to add multiple ‘Value‘ lines into one chart. Again its important is generic because I would like to use this in hundreds maybe thousands of fields in the future. -
How are you trying to achieve it?
I was thinking about having a flux query that has min, max and mean of a window and using the name of the field to group them so they show properly in the legend and in the graph. -
What happened?
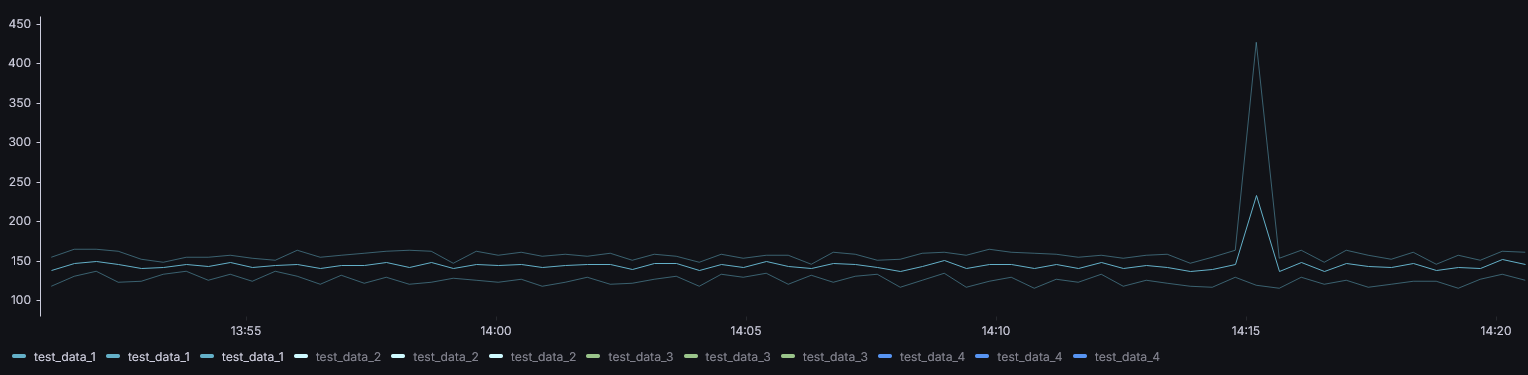
I got this:
I got that it displays the min, max and mean of each field into the window but it has 3 times in the legend. I have this flux query:base = from(bucket: “marble_bucket”) |> range(start: v.timeRangeStart, stop: v.timeRangeStop) |> filter(fn: (r) => r._measurement == “test_metrics”) |> group(columns: [“_field”]) agg = (fnName, fnRef) => base |> aggregateWindow(every: v.windowPeriod, fn: fnRef, createEmpty: false) |> map(fn: (r) => ({ _time: r._time, _field: r._field, _value: float(v: r._value), agg_type: fnName, series: r._field })) meanData = agg(fnName: “mean”, fnRef: mean) maxData = agg(fnName: “max”, fnRef: max) minData = agg(fnName: “min”, fnRef: min) combined = union(tables: [meanData, maxData, minData]) pivoted = combined |> pivot( rowKey: [“_time”, “_field”], columnKey: [“agg_type”], valueColumn: “_value” ) avgPerField = pivoted |> map(fn: (r) => ({ _time: r._time, _field: r._field, _value: (r.mean + r.min + r.max) / 3.0 })) pivotedAnd using transform: rename by regex in Grafana with this:
match: ^(mean|min|max) (.*)$
replace: $2
to make it look like the Image I posted. -
What did you expect to happen?
I expected that I would be able to hide the min and the max in the legend but still being able to display them and when I press the field in the legend I would be able to hide the other stuff except the max, min and mean of that field. -
Can you copy/paste the configuration(s) that you are having problems with?
Already posted them above but I am mainly having problems with grouping the fields with min, max and mean right and being able to group them. I do not know if this is possible in the Grafana settings of the panel of in the Influx query. -
Did you receive any errors in the Grafana UI or in related logs? If so, please tell us exactly what they were.
I did not get any errors but I did get unexpected behavior that when I hide the labels with the min, and max in the legend and only display the mean I am unable to press them. Also if I select an time frame in the graph it visually selects them but does not zoom into that time frame. -
Did you follow any online instructions? If so, what is the URL?
I used the Time series doc (https://grafana.com/docs/grafana/latest/panels-visualizations/visualizations/time-series/), Also tried with regex: ( Support "Fill Below To Regex" series override to allow generic, repeatable shading · Issue #85757 · grafana/grafana · GitHub )Hope someone is able to help me with this issue and if there are any questions just let me know!