How to form a Grafana Query to populate a Graph of Test Suite Stability i.e. no_total_test, no_test_passed, no_test_failed etc

Hi @mefraimsson, @marcuscalidus @torkel @daniellee could you please help me regarding below query?
I have stored data as below now


and formed a Grafana query as below

SELECT
UNIX_TIMESTAMP(submission_date) as time_sec,
count(no_total_test) as value,
testcase_name as metric
FROM
TestSuiteData
WHERE
$__timeFilter(submission_date)
GROUP BY 1, 3
ORDER BY 1

My Graph look like this


Now,How can I form a query for my DataSource to represent health of each TestSuite i.e. no_total_test, no_test_passed, no_test_failed etc.

Hi,

Create one additional query for each TestSuite and add the test suite to the metric column, i.e.

SELECT
UNIX_TIMESTAMP(submission_date) as time_sec,
count(no_total_test) as value,
'Total - ' + testcase_name as metric
FROM
TestSuiteData
WHERE
$__timeFilter(submission_date)
GROUP BY 1, 3
ORDER BY 1

Maybe easier to use a table panel for visualizing all this though, but should work.

Marcus

1 Like

Thank you @mefraimsson, below are the exact two dashboard I want to achive. I need help to form a query.

  1. Individuals Test Suite Test Data representation as below

2.Collective All Test Suite Average Test failure over period of time as below

Thanks for being so kind to me…

Hi,

Already solved with my last post right? Another option would be to have a graph panel per each test case - then you can have all the test cases in a template variable and enable repeat of the panels based on selected template variable values. See repeating panels.

Do you want to have average per day? In that case something like this could work?

SELECT
$__timeGroup(submission_date,'24h') as time_sec,
avg(no_test_failed) as value,
testcase_name as metric
FROM
TestSuiteData
WHERE
$__timeFilter(submission_date)
GROUP BY 1, 3
ORDER BY 1

Please note that you’ll need to use the nightly build/v5.0 beta of Grafana to be able to use the $__timeGroup macro function - will be included in Grafana v5.0. If you’re on v4.6.3 you should be able to use cast(cast(UNIX_TIMESTAMP(<date column>)/(<seconds>) as signed)<seconds> as signed) as time_sec.

Please refer to Using MySQL in Grafana documentation for more information.

Marcus

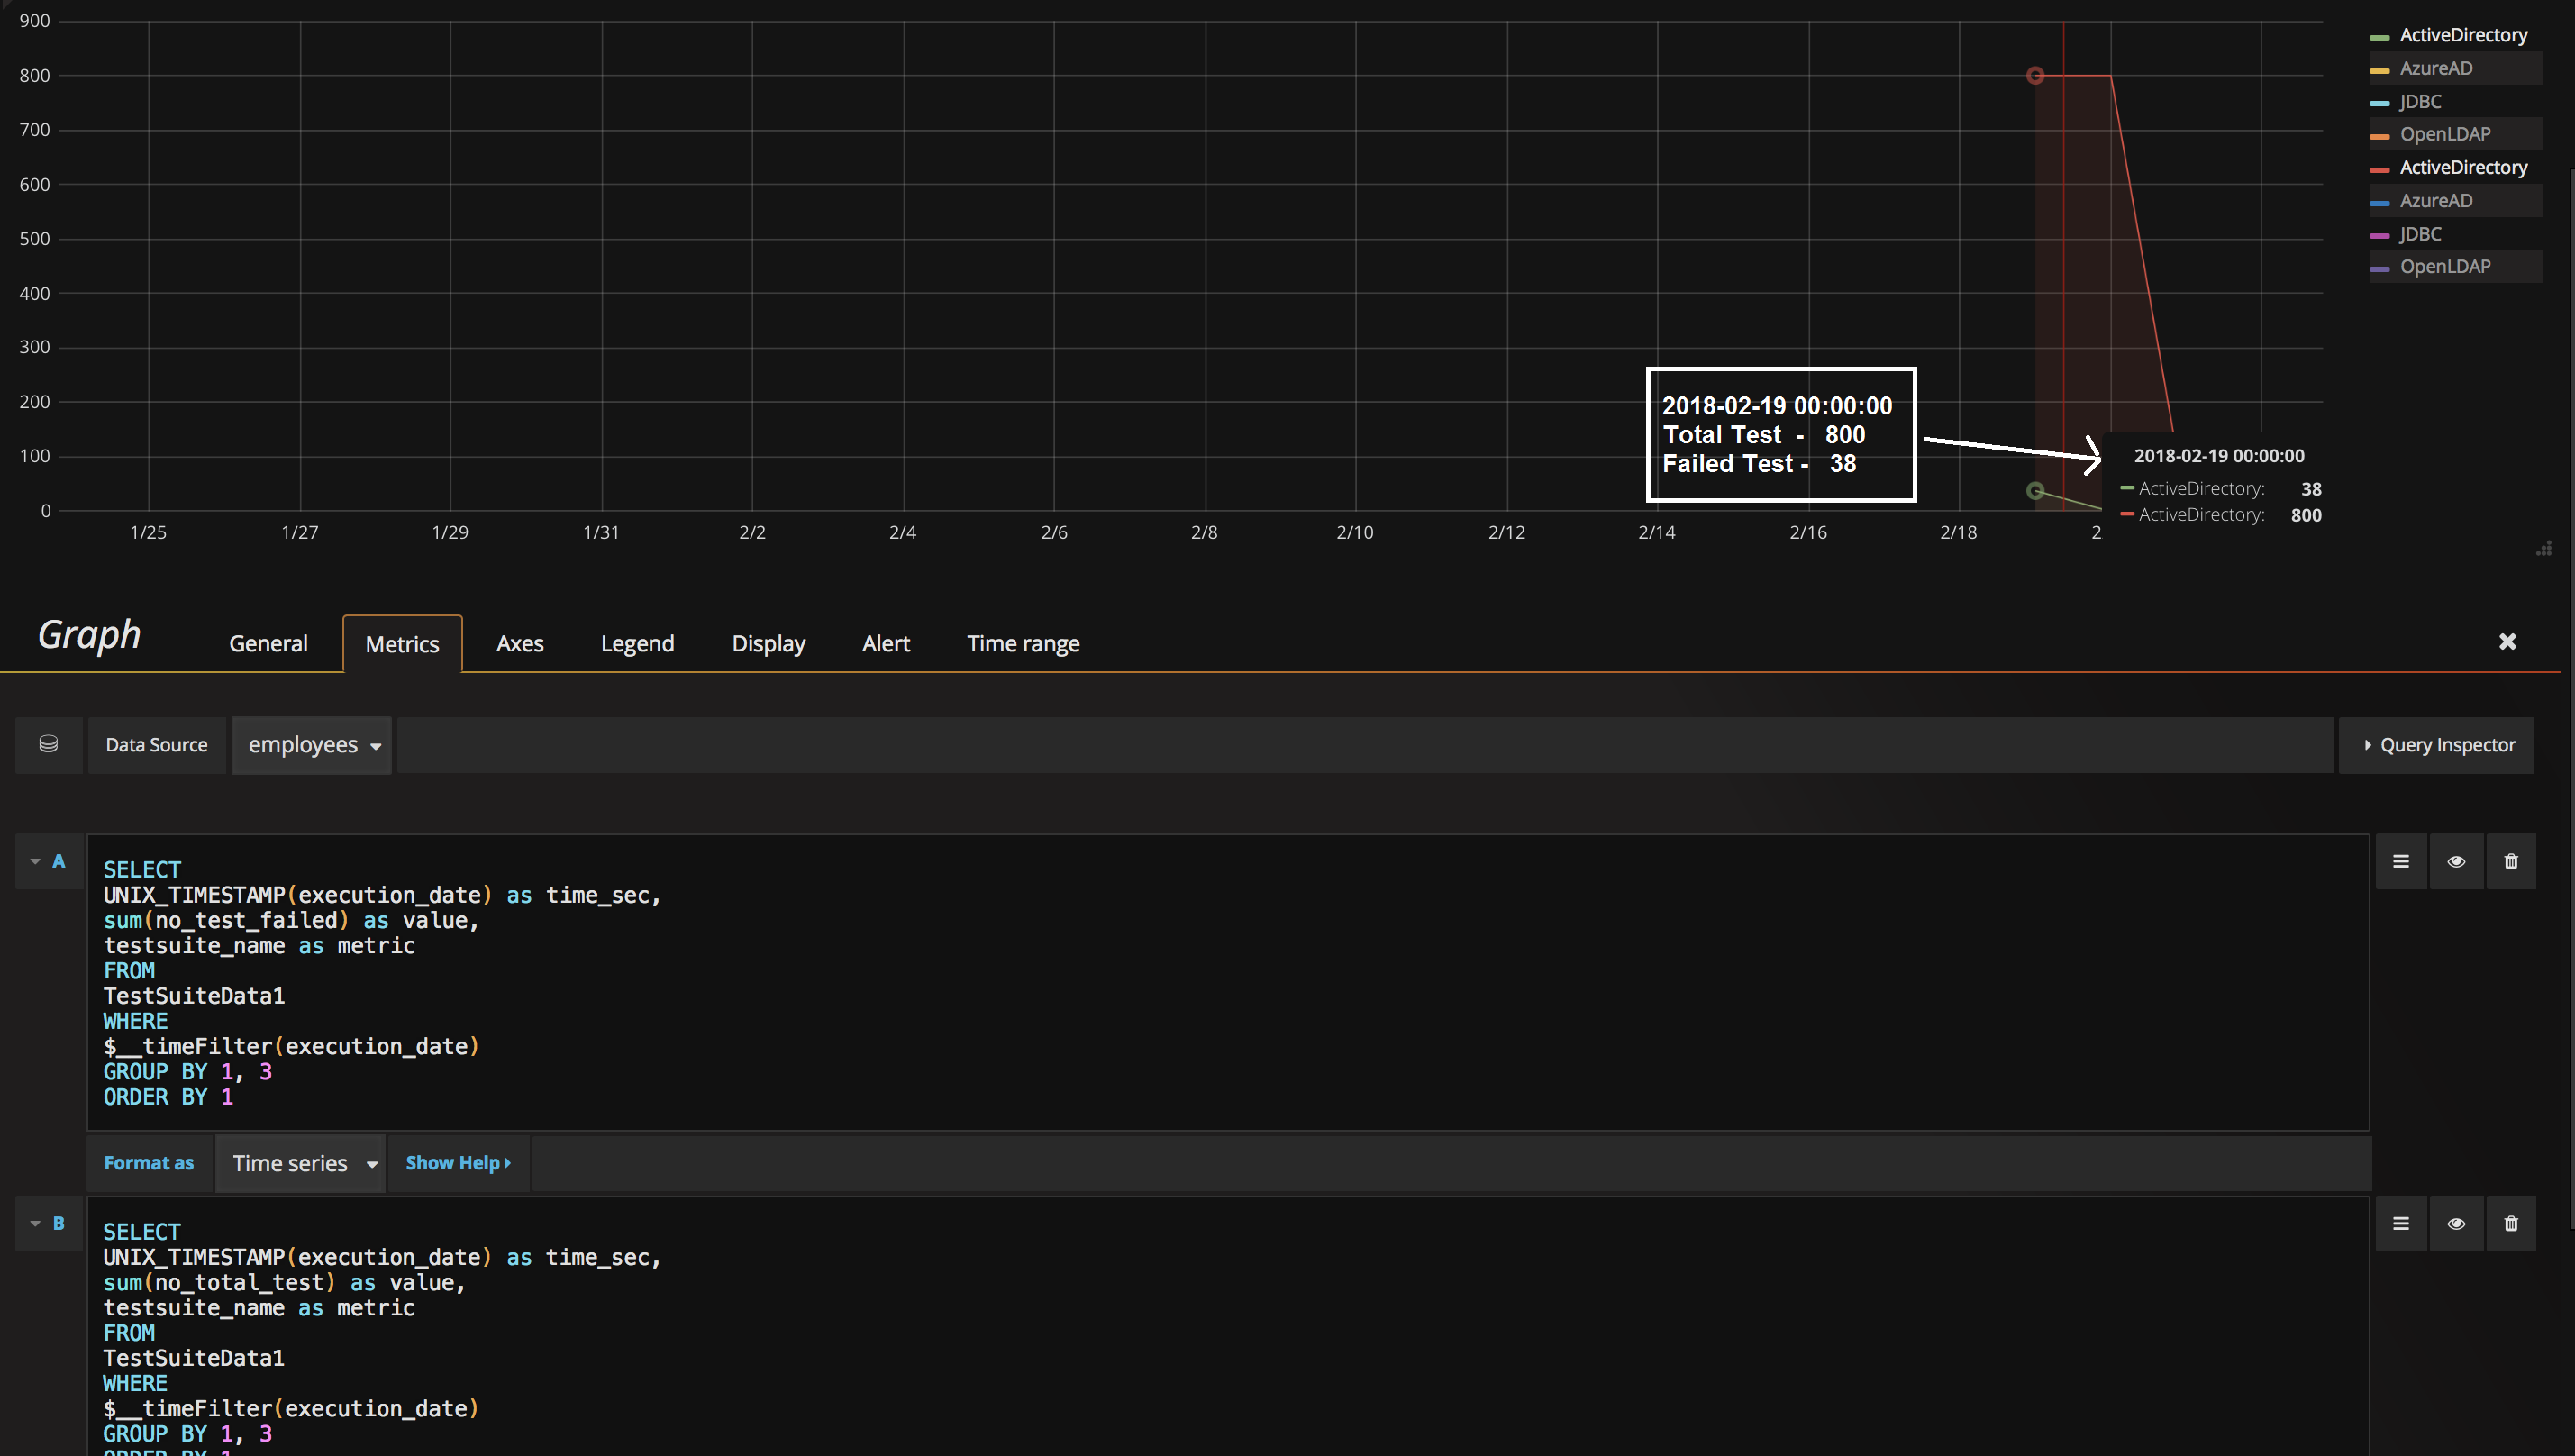
The Metrics I’m getting by above queries is “no. of test suite execution per day”

SELECT
UNIX_TIMESTAMP(execution_date) as time_sec,
count(no_total_test) as value,
testsuite_name as metric
FROM
TestSuiteData
WHERE
$__timeFilter(execution_date)
GROUP BY 1, 3
ORDER BY 1

and

SELECT
UNIX_TIMESTAMP(execution_date) as time_sec,
count(no_test_failed) as value,
testsuite_name as metric
FROM
TestSuiteData
WHERE
$__timeFilter(execution_date)
GROUP BY 1, 3
ORDER BY 1

e.g. ActiveDirectory executed 10 times, next is double of that, next one is triple of that

it’s completely a random graphs.

My Goal is to achive…

  1. One comman graph which will represent all test suite health over period of time i.e. test suite wise % failures, passing for time series.

  2. Individual test suite test data for given time series i.e. total test, test passed, test failed and test skipped

e.g. JDBC suite I want to show how over period of time the results look like.

My DB is

create table TestSuiteData1 (
   testsuite_name VARCHAR(400) NOT NULL,
   no_total_test INT NOT NULL,
   no_test_passed INT NOT NULL,
   no_test_failed INT NOT NULL,
   no_test_skipped INT NOT NULL,
   execution_date DATE
);

And the Data that I added is

INSERT INTO `TestSuiteData1` VALUES 
     ('ActiveDirectory',800,750,38,12,'2018-02-19'),
     ('AzureAD',500,500,0,0,'2018-02-19'),
     ('JDBC',43,43,0,0,'2018-02-19'),
     ('OpenLDAP',78,0,78,0,'2018-02-19'),
     ('ActiveDirectory',800,0,0,800,'2018-02-20'),
     ('AzureAD',534,0,0,0,'2018-02-20'),
     ('JDBC',4,0,0,0,'2018-02-20'),
     ('OpenLDAP',78,0,23,0,'2018-02-20'),
     ('ActiveDirectory',8,750,38,12,'2018-02-21'),
     ('AzureAD',5,54,456,34,'2018-02-21'),
     ('JDBC',4,43,5,56,'2018-02-21'),
     ('OpenLDAP',78,0,23,0,'2018-02-21');

Is it possible to do something as below, so that I could get all data to form 1st graph

SELECT
UNIX_TIMESTAMP(execution_date) as time_sec,
count(no_total_test) as value,
count(no_test_passed) as value,
count(no_test_failed) as value,
count(no_test_skipped) as value,
testsuite_name as metric
FROM
TestSuiteData1
WHERE
$__timeFilter(execution_date)
GROUP BY 1, 6
ORDER BY 1

Hi,

I think you want to do a sum instead of count and make sure that Stacked value=Individual under the display tab.

SELECT
UNIX_TIMESTAMP(execution_date) as time_sec,
sum(no_test_failed) as value,
testcase_name as metric
FROM
TestSuiteData
WHERE
$__timeFilter(execution_date)
GROUP BY 1, 3
ORDER BY 1

For 1) I would create one graph panel with 2 queries, total % passed and total % failed, per day.

SELECT
UNIX_TIMESTAMP(execution_date) as time_sec,
no_test_failed/no_total_test as value,
'total % failed' as metric
FROM
TestSuiteData
WHERE
$__timeFilter(execution_date)
GROUP BY 1
ORDER BY 1
SELECT
UNIX_TIMESTAMP(execution_date) as time_sec,
no_test_passed/no_total_test as value,
'total % passed' as metric
FROM
TestSuiteData
WHERE
$__timeFilter(execution_date)
GROUP BY 1
ORDER BY 1

For 2) I would create one graph panel per test suite name and filter the queries by `WHERE testcase_name=‘JDBC’ as example for JDBC. This is where you can use repeating panels as I mentioned earlier.

Marcus

1 Like

Getting error for first query

Error 1055: Expression #2 of SELECT list is not in GROUP BY clause and contains nonaggregated column ‘employees.TestSuiteData1.no_test_failed’ which is not functionally dependent on columns in GROUP BY clause; this is incompatible with sql_mode=only_full_group_by

Now, I started understanding the SQL quries. I have placed two queries for graph of ‘ActiveDirectory’ Failed Test vs Total Test Cases as below with proper data

Now, if I hover over the graph I could see
“ActiveDirectory = 800”
“ActiveDirectory = 38”

I should see it as

“Total Test = 800”
“Failed Test = 38”

How can I achive it?

Hi,

You need to have query for only the total, i.e.

SELECT
UNIX_TIMESTAMP(execution_date) as time_sec,
no_total_test as value,
'Total' as metric
FROM
TestSuiteData
WHERE
$__timeFilter(execution_date)
GROUP BY 1
ORDER BY 1

And then a second query for the failed tests, i.e.

SELECT
UNIX_TIMESTAMP(execution_date) as time_sec,
sum(no_test_failed) as value,
testcase_name + ' failures' as metric
FROM
TestSuiteData
WHERE
$__timeFilter(execution_date)
GROUP BY 1, 3
ORDER BY 1

Marcus

1 Like

Thanks Marcus for all your help. I’m greatful.