I am create Boxplots graph to analysis the data . my API responce is in json type like
[{“Nationality”: “Myanmar”, “Gender”: “Female”, “Country”: “Thailand”, “Max_Value”: 426.42, “Min_Value”: 0.0, “Mean_Value”: 71.93}, {“Nationality”: “Myanmar”, “Gender”: “Female”, “Country”: “Thailand”, “Max_Value”: 417.03, “Min_Value”: 0.0, “Mean_Value”: 54.4}, {“Nationality”: “Myanmar”, “Gender”: “Female”, “Country”: “Thailand”, “Max_Value”: 391.6, “Min_Value”: 0.0, “Mean_Value”: 77.81}, {“Nationality”: “Myanmar”, “Gender”: “Female”, “Country”: “Thailand”, “Max_Value”: 221.07, “Min_Value”: 0.0, “Mean_Value”: 31.7}]
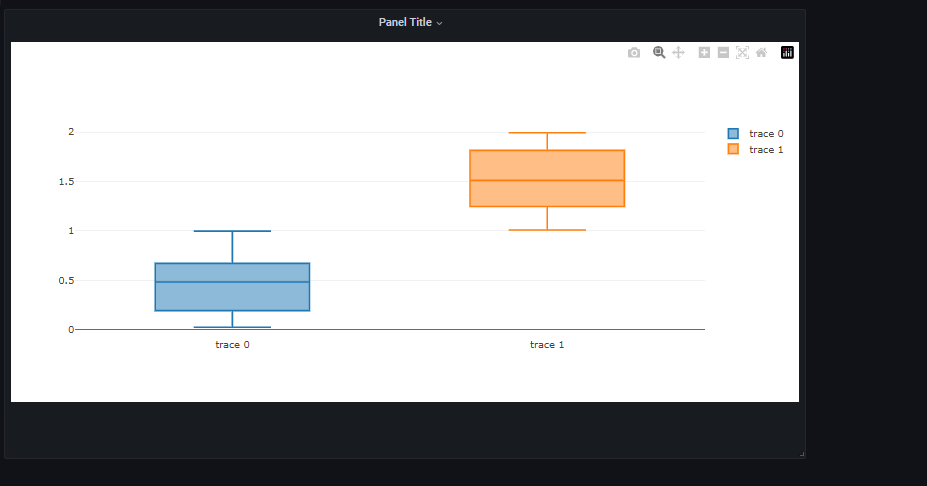
How i create Boxplots graph using this data.
THANK YOU!!
~ the grafana team