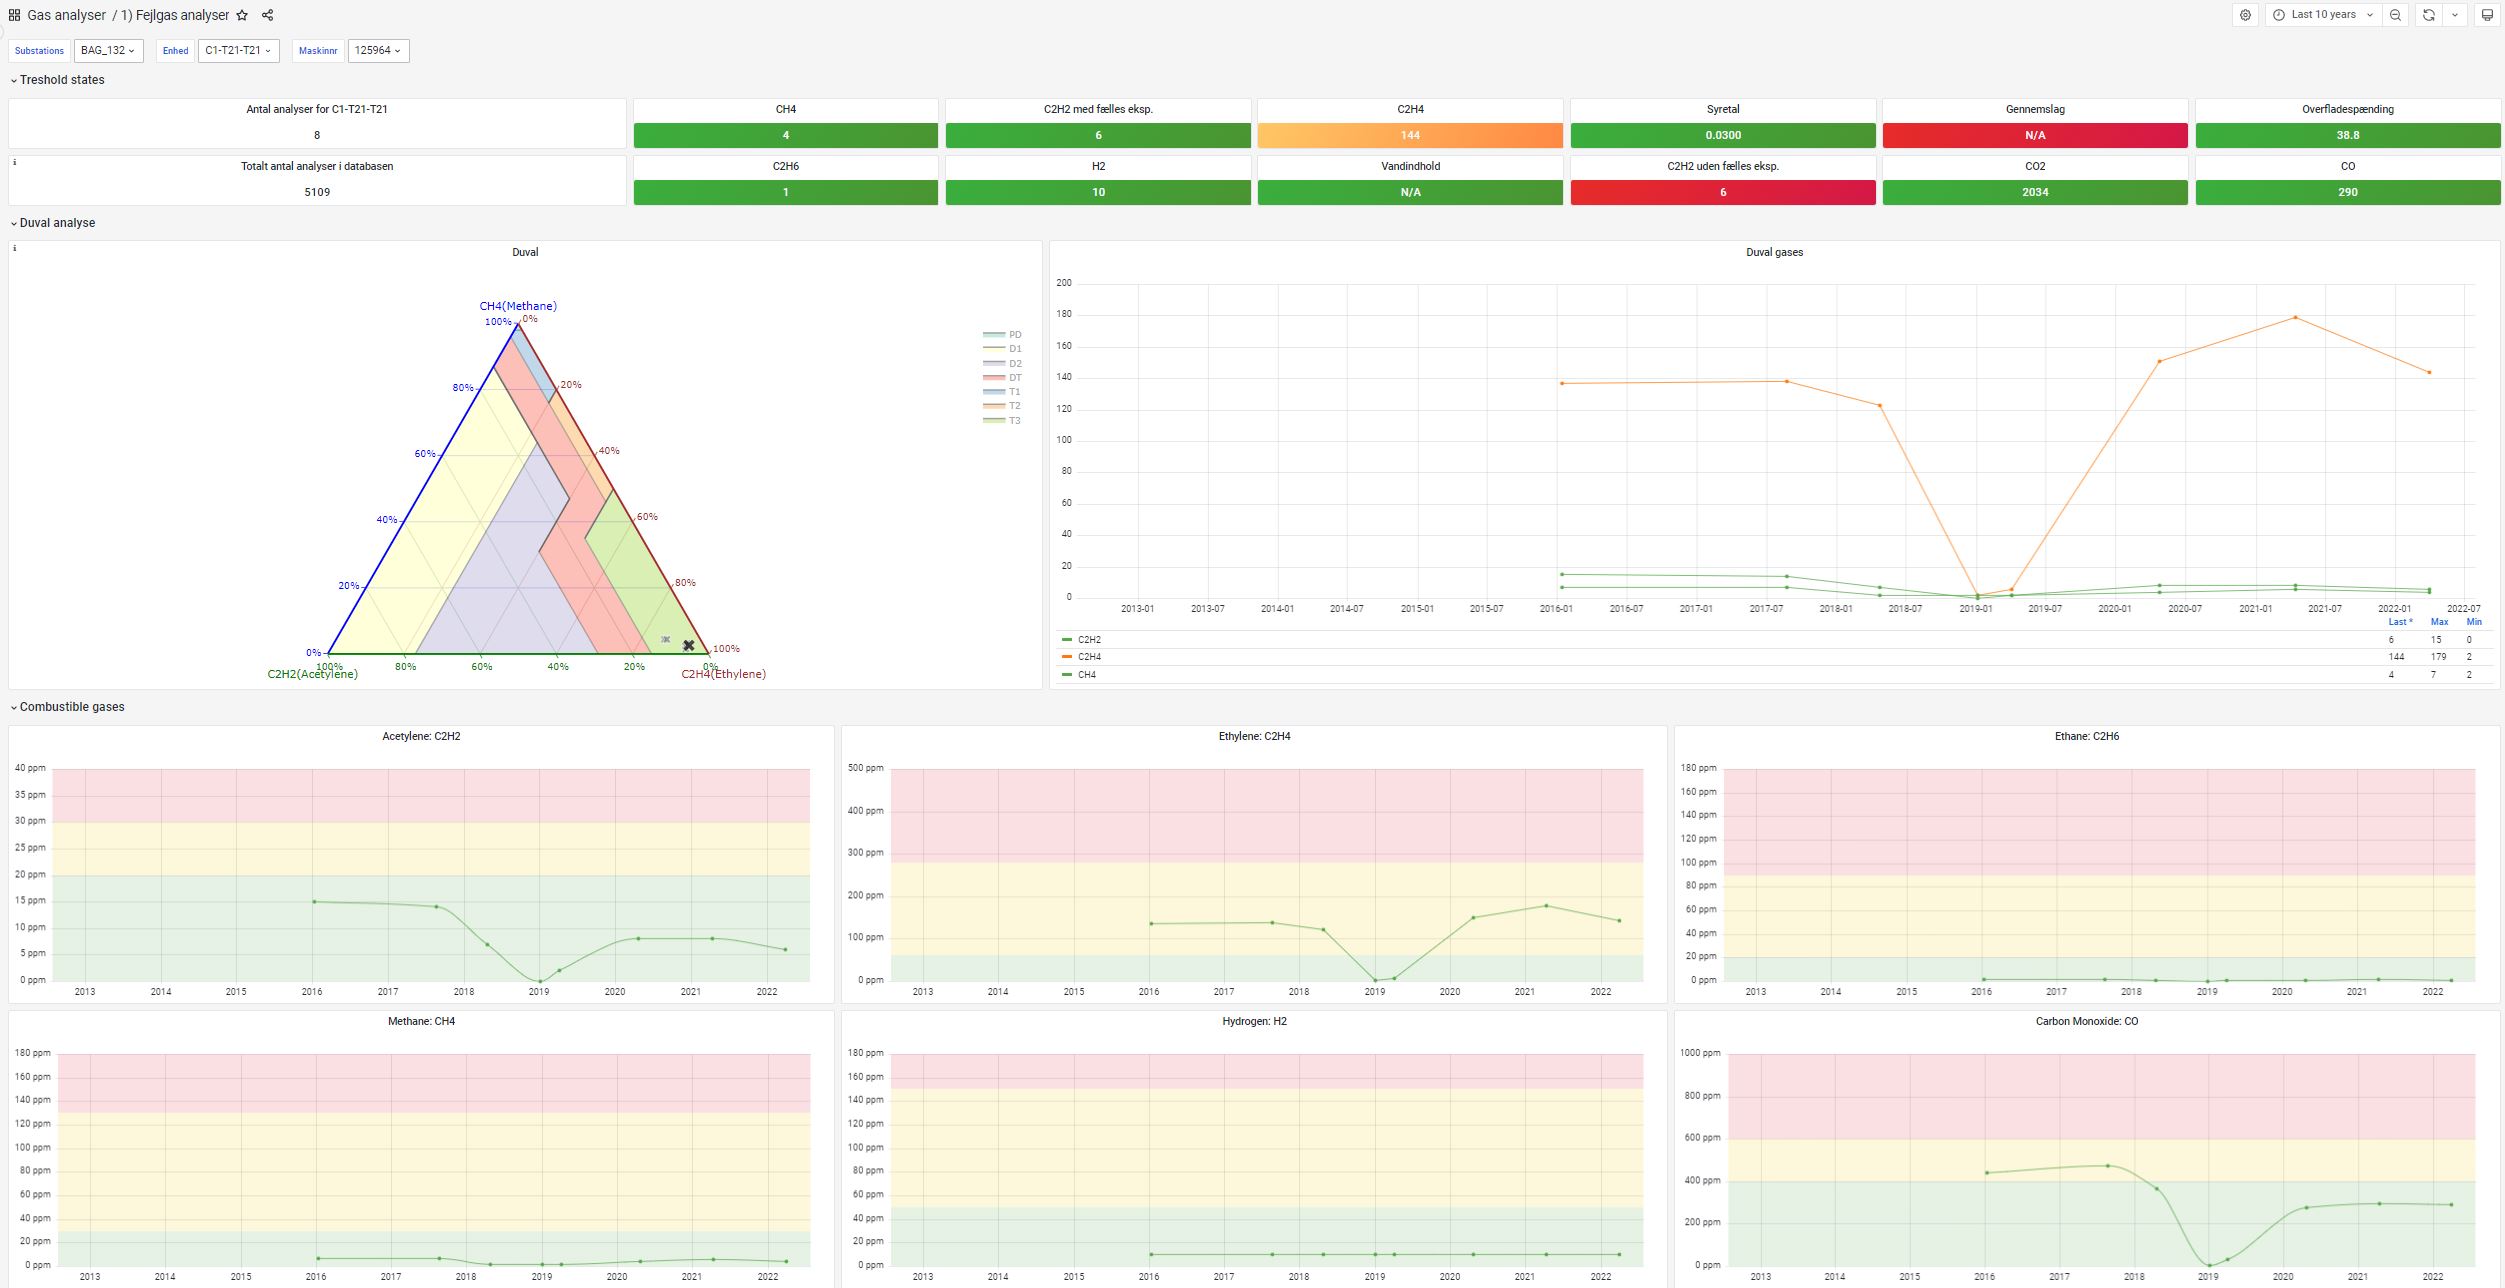
I know it is possible due to seeing it here: https://grafana.com/static/assets/img/blog/transformer-fault-gas-and-duval-analysis.jpg
But not sure which plugin they used to do it. If anyone knows I would appreciate some help.
Did anyone work out how to do this and create a duval triangle?

I’ll try that thank you.