How to create a dashboard with a graph through the http api?

I have a postgresql datasource in my grafana docker container.
This database has a table called posts, where 1 column is of type Time, and another of type Float.

I’m trying to create, using the http api, a dashboard with a graph with this data being updated every 5s.
Every other detail could be the default value.

So, far the only docs related to this was this. HOwever, it’s too simple, and the information seems to be incomplete for my objective…
I’ve tried sending the json below as the payload, but I get a 400 error, i.e. the body isn’t being processed, because I’m doing some mistake in it.
This is a json I saved from a different datasource, but of similar type…

{
    "datasource": {
      "type": "postgres",
      "uid": "aff899bb-691e-4a19-aad8-7c17fc47e845"
    },
    "fieldConfig": {
      "defaults": {
        "custom": {
          "drawStyle": "line",
          "lineInterpolation": "linear",
          "barAlignment": 0,
          "lineWidth": 1,
          "fillOpacity": 0,
          "gradientMode": "none",
          "spanNulls": false,
          "showPoints": "auto",
          "pointSize": 5,
          "stacking": {
            "mode": "none",
            "group": "A"
          },
          "axisPlacement": "auto",
          "axisLabel": "",
          "axisColorMode": "text",
          "scaleDistribution": {
            "type": "linear"
          },
          "axisCenteredZero": false,
          "hideFrom": {
            "tooltip": false,
            "viz": false,
            "legend": false
          },
          "thresholdsStyle": {
            "mode": "off"
          }
        },
        "color": {
          "mode": "palette-classic"
        },
        "mappings": [],
        "thresholds": {
          "mode": "absolute",
          "steps": [
            {
              "color": "green",
              "value": null
            },
            {
              "color": "red",
              "value": 80
            }
          ]
        }
      },
      "overrides": []
    },
    "gridPos": {
      "h": 8,
      "w": 12,
      "x": 0,
      "y": 0
    },
    "id": 2,
    "options": {
      "tooltip": {
        "mode": "single",
        "sort": "none"
      },
      "legend": {
        "showLegend": true,
        "displayMode": "list",
        "placement": "bottom",
        "calcs": []
      }
    },
    "targets": [
      {
        "datasource": {
          "type": "postgres",
          "uid": "aff899bb-691e-4a19-aad8-7c17fc47e845"
        },
        "editorMode": "code",
        "format": "table",
        "key": "Q-935d0f25-aa95-4f80-b230-cd4e675787a5-0",
        "rawQuery": true,
        "rawSql": "SELECT created_at, rating FROM posts ",
        "refId": "A",
        "sql": {
          "columns": [
            {
              "parameters": [
                {
                  "name": "created_at",
                  "type": "functionParameter"
                }
              ],
              "type": "function"
            },
            {
              "parameters": [
                {
                  "name": "rating",
                  "type": "functionParameter"
                }
              ],
              "type": "function"
            }
          ],
          "groupBy": [
            {
              "property": {
                "type": "string"
              },
              "type": "groupBy"
            }
          ]
        },
        "table": "posts"
      }
    ],
    "title": "Ratings",
    "type": "timeseries"
  }
Please post your python code

Here’s the method:

self.API_DASHBOARDS = "/api/dashboards/db"
self.grafana_url = f"http://{self.user}:{self.password}@{self.host}:{self.port}"
self.headers = {
            "Accept": "application/json",
            "Content-Type": "application/json",
            "Authorization": f"Bearer {self.api_key}",
        }
def upload_to_grafana(self, database:PostgresDB, json_content:json_type|None=None):
        '''
        Upload dashboard, through a json file,  to grafana and prints response.
        If no json is provided, we just use `grafana_dashboard.json`

        :param json - dashboard json generated by grafanalib
        '''
        if json_content is None:
            with open("grafana/grafana_dashboard.json") as json_file:
                json_content = json.load(json_file)
        if json_content is None:
            raise JsonError        
        response = requests.post(
            self.grafana_url+self.API_DASHBOARDS, 
            data=json_content, 
            headers=self.headers,
            timeout=2,
        )
        if response.status_code == 200:
            print(
                """
                Dashboard creation of PostgreSQL was successfull.
                """
            )
        else:
            print(response.json())

After some reading, (maaaany) experiments, and chatgpt… :smiley:
I’m getting much closer.

I’ve changed the payload to this:

        dashboard_config = {
                "id": None,
                "title": "Python API Development",
                "panels": [
                    {
                        "title": "Ratings",
                        "type": "graph",
                        "datasource": f"{database.type}Python",
                        "targets": [
                            {
                                "expr": "SELECT created_at, rating FROM posts",
                                "rawQuery": True,
                                "rawSql": "SELECT created_at, rating FROM posts ",
                                "sql": {
                                    "columns": [
                                    {
                                        "type": "function",
                                        "parameters": [
                                        {
                                            "type": "functionParameter",
                                            "name": "created_at"
                                        }
                                        ]
                                    },
                                    {
                                        "type": "function",
                                        "parameters": [
                                        {
                                            "type": "functionParameter",
                                            "name": "rating"
                                        }
                                        ]
                                    }
                                    ],
                                },
                                "table": "posts"
                            }
                        ],
                        "xaxis": {
                            "mode": "time"
                        },
                        "gridPos": {
                            "x": 0,
                            "y": 0,
                            "h": 7,
                            "w": 9
                        },
                    }
                ],
                "refresh": "5s"
            }

        payload = {
            "dashboard":dashboard_config,
            "folderId": 0,
            "overwrite": False
        }

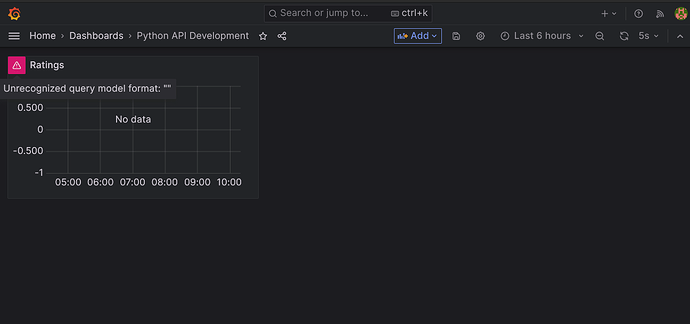
But this json body still isn’t able to introduce the data… I only get what’s in the picture above.

Done! :slight_smile:

I had to add “format”:“table”, to the target section.

1 Like

Hi @ivoavtavares :wave:

This is awesome !!

It will be really great if you can describe the complete steps as we see this post as a very good potential to be moved into our How To category and can be used by all community users as a reference :slight_smile: