Hi,
I’m just starting with prometheus/grafana, and I struggle to display a simple bar graph that should display my daily power consumption.
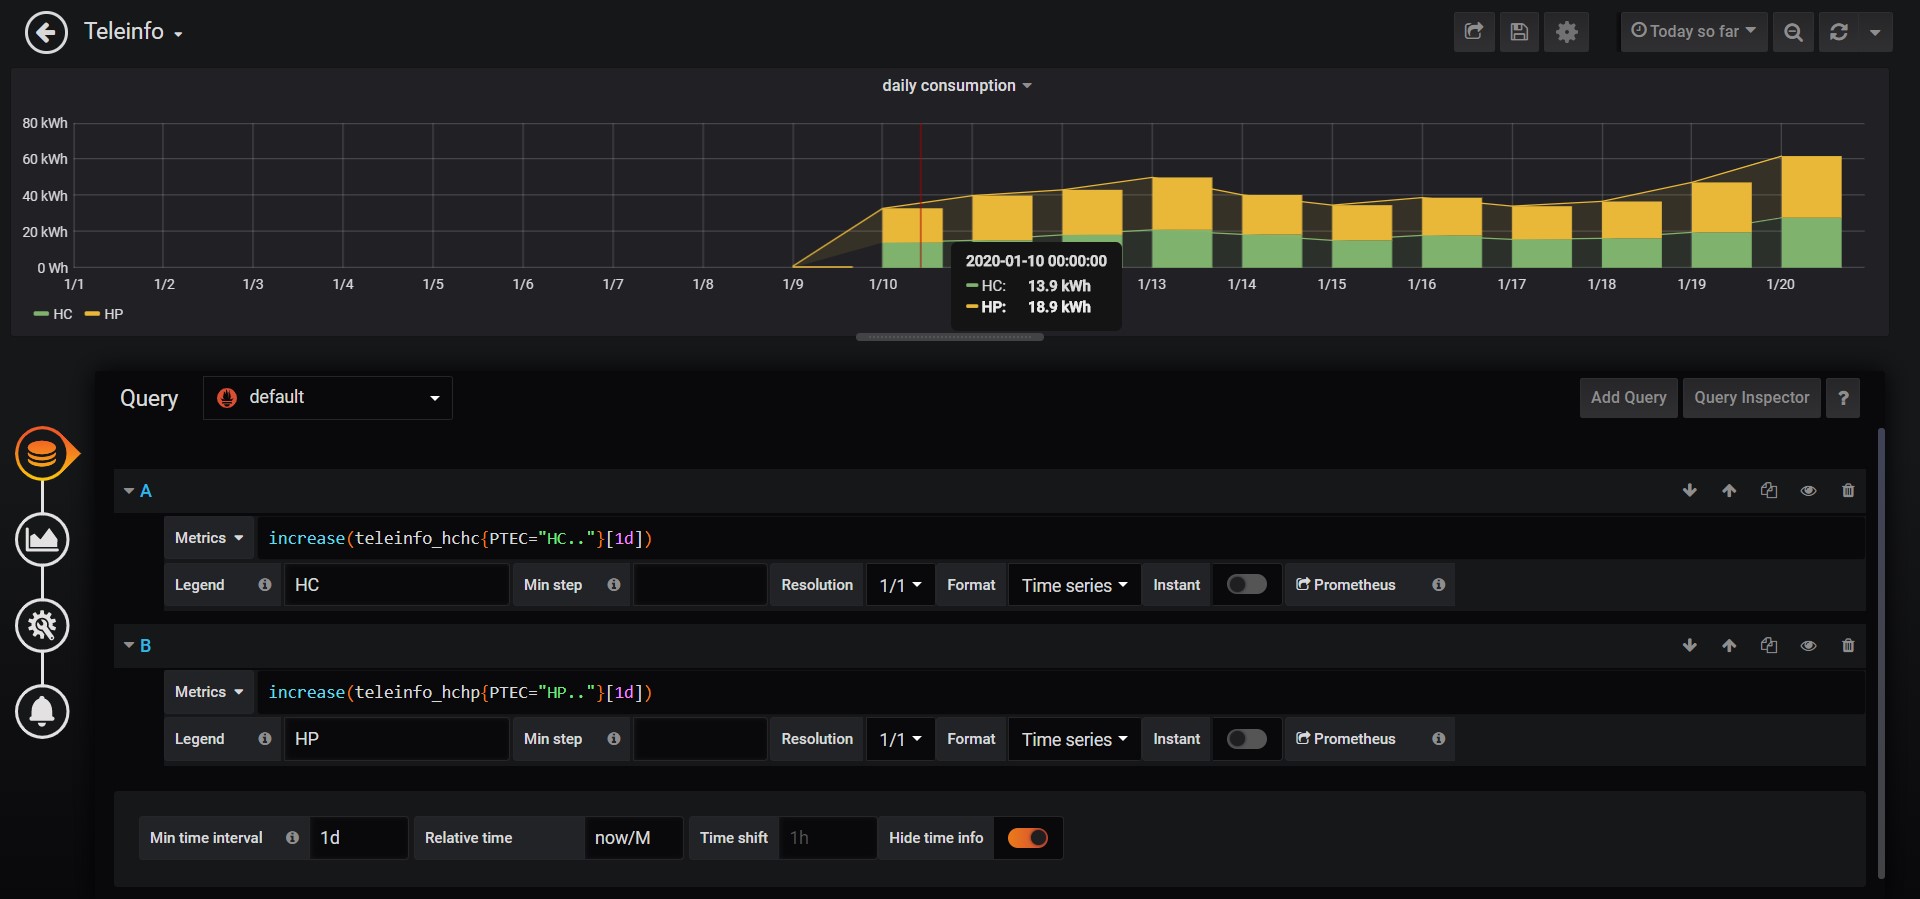
My queries seems ok, but when the mouse is over a daily bar, the values are from the day before. (sounds coherent because the time in the popup is 00:00)
Is there a way to display proper daily bar graph ?
I mean when the mouse is over January 10, the value is the delta between 2020-01-11T00:00Z and 2020-01-10T00:00Z
Thanks