There is no way to put labels on the bars and there is no custom x-axis label.
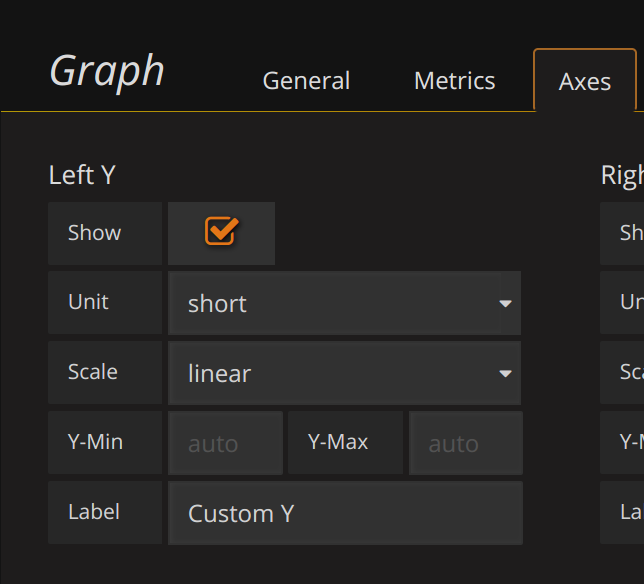
Custom y axis labels can be set on the Axes tab: