How to add extra info in tooltips on Grafana Time Series dashboard based on SQL?

I have a table with 4 columns:
date, name, num_value, comment.

I can plot Grafana time series using this SQL:
select date, name, num_value as " " from T

and applying transformation: Prepare Time Series → Format → Multi-frame time series.
The tooltip shows (date, name, value).

I would like to add to tooltip the content of column “comment” in my table T.
How to do it?

There is similar feature request created on Aug 29, 2023:

Thanks!

3 Likes

I see so many people requesting this online. Seems like a no brainer feature. There doesn’t even seem to be a good workaround

looks it still needs some polishing but something is available in latest grafana v11

Could you share how you achieved this? I’m trying to show text values in tooltips as well and this looks exactly like what I’m looking for.

the picture I posted above is exactly how I did it. what is your datasource

Thanks for your reply. I tried replicating your query format:

SELECT  
    'foo' as comment, 
    33.7 as num_value, 
    'juicy' as metrics, 
    '2024-11-11' as time 
FROM issue_stats

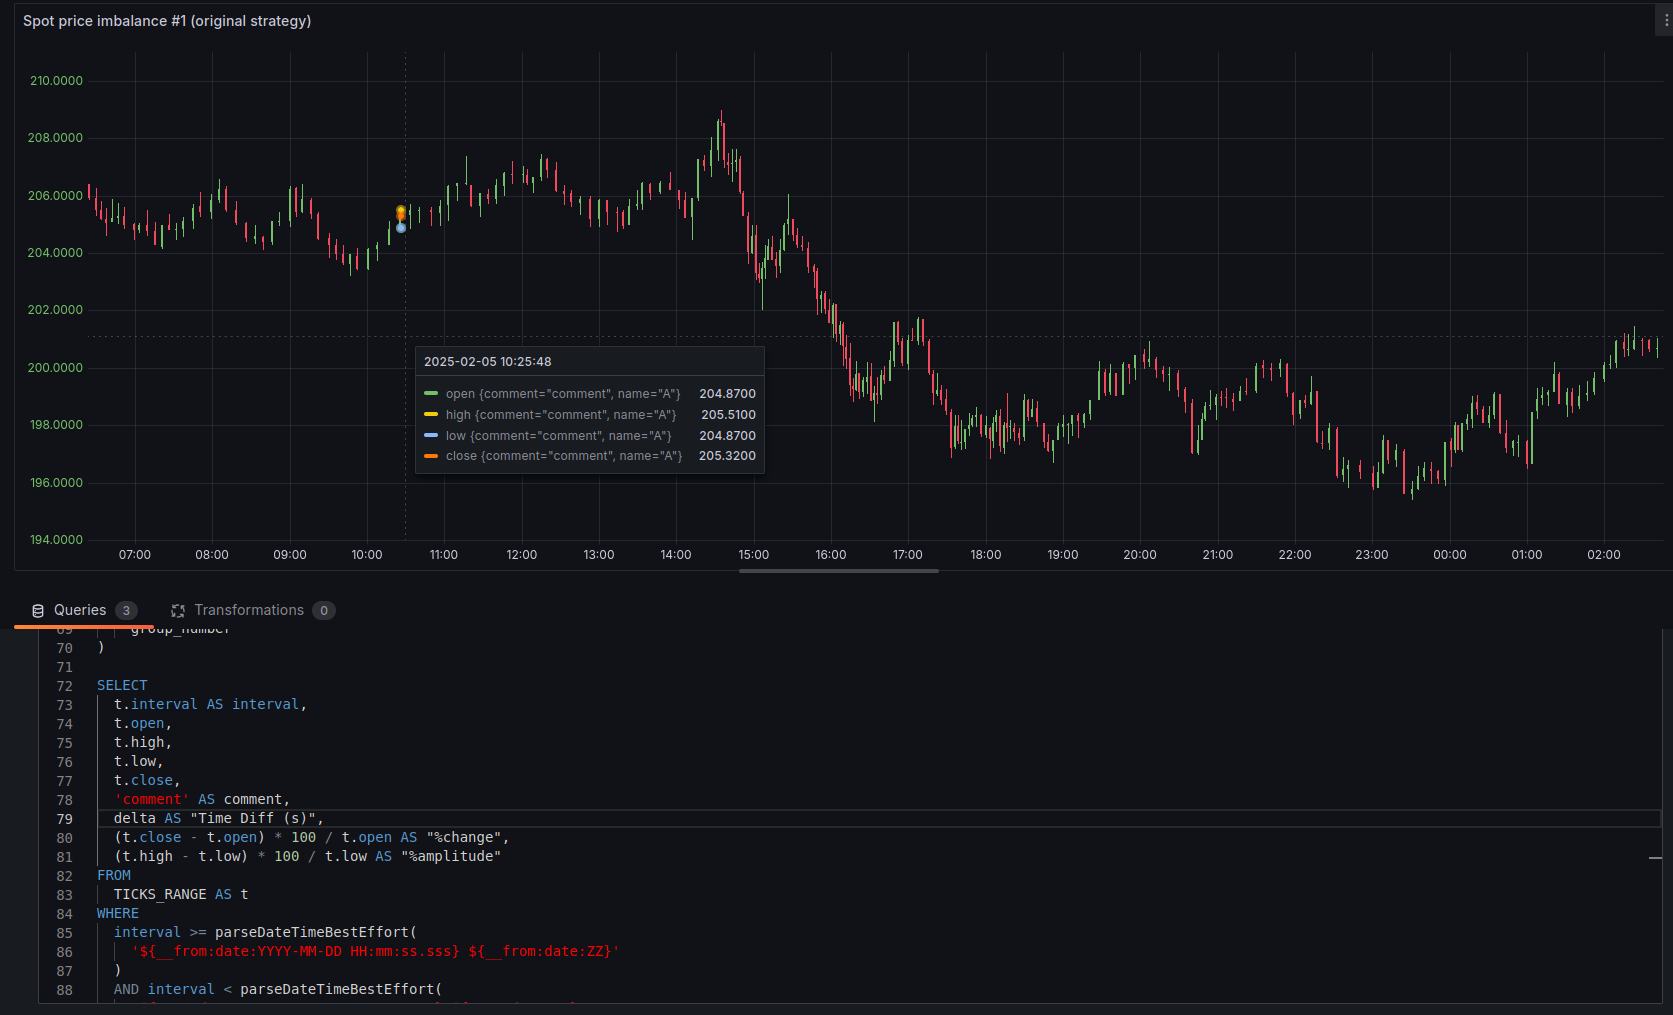
But I can only see the timestamp and numeric values in the tooltip - the string values (comment, metrics) don’t show up. I’m using MySQL as my data source.

Am I missing something in the configuration? Do you have any additional settings or transformations applied to make the text values appear in the tooltip?