- What Grafana version and what operating system are you using?
We have migrated Grafana OSS 8.5.0 to Grafana OSS 9.0.1 (rpm, on RHEL7). Storage is local sqlite file.
- How are you trying to achieve it?
We had different home dashboards set per team. Generally like
- “Default Home Dashboard” for unassigned users
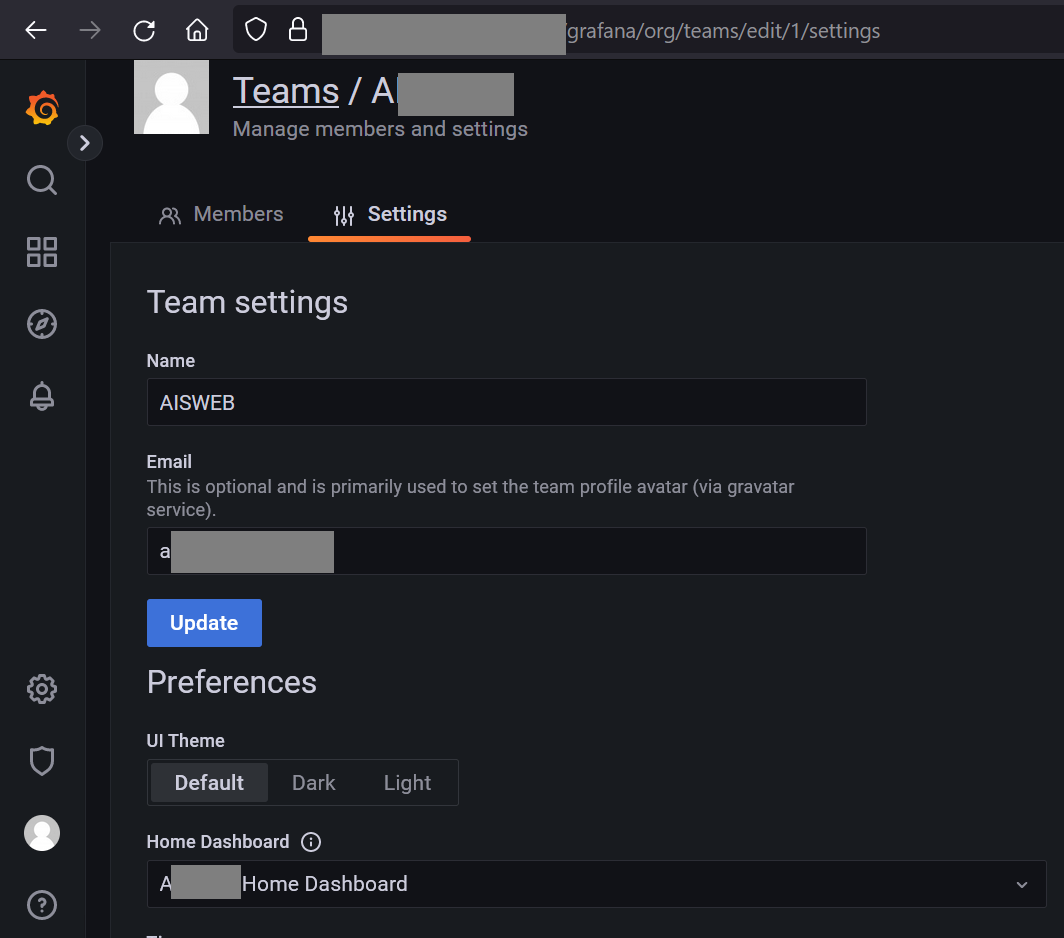
- “A Home Dashboard” for users belonging to A team
- “D Home Dashboard” for users belonging to D team
-
What happened?
After migration from 8.5.0 to 9.0.1 users have presented “default home dashboard” regardless that they had different home dashboard set in the team they belong.
That is all users in A team have “Default Home Dashboard” and not “A Home Dashboard” even afeter Grafana restarted, user force logged-out from Grafana UI, and users’ browser cookies cleared. -
What did you expect to happen?
Team’s home dashboard should precede over default. -
Can you copy/paste the configuration(s) that you are having problems with?
(will provide if needed) -
Did you receive any errors in the Grafana UI or in related logs? If so, please tell us exactly what they were.
DB Migrations completed correctly
/var/log/grafana/grafana.log
logger=settings t=2022-06-30T08:48:31.348244471-04:00 level=info msg=“Starting Grafana” version=9.0.1 commit=14e988bd22 branch=HEAD compiled=2022-06-21T09:43:01-04:00
logger=settings t=2022-06-30T08:48:31.348444975-04:00 level=info msg=“Config loaded from” file=/usr/share/grafana/conf/defaults.ini
logger=settings t=2022-06-30T08:48:31.348476472-04:00 level=info msg=“Config loaded from” file=/etc/grafana/grafana.ini
logger=settings t=2022-06-30T08:48:31.348488809-04:00 level=info msg=“Config overridden from command line” arg=“default.paths.data=/var/lib/grafana”
logger=settings t=2022-06-30T08:48:31.348503607-04:00 level=info msg=“Config overridden from command line” arg=“default.paths.logs=/var/log/grafana”
logger=settings t=2022-06-30T08:48:31.348529234-04:00 level=info msg=“Config overridden from command line” arg=“default.paths.plugins=/var/lib/grafana/plugins”
logger=settings t=2022-06-30T08:48:31.348544757-04:00 level=info msg=“Config overridden from command line” arg=“default.paths.provisioning=/etc/grafana/provisioning”
logger=settings t=2022-06-30T08:48:31.348562991-04:00 level=info msg=“Path Home” path=/usr/share/grafana
logger=settings t=2022-06-30T08:48:31.348577693-04:00 level=info msg=“Path Data” path=/var/lib/grafana
logger=settings t=2022-06-30T08:48:31.348588551-04:00 level=info msg=“Path Logs” path=/var/log/grafana
logger=settings t=2022-06-30T08:48:31.348603509-04:00 level=info msg=“Path Plugins” path=/var/lib/grafana/plugins
logger=settings t=2022-06-30T08:48:31.348614538-04:00 level=info msg=“Path Provisioning” path=/etc/grafana/provisioning
logger=settings t=2022-06-30T08:48:31.348630303-04:00 level=info msg=“App mode production”
logger=sqlstore t=2022-06-30T08:48:31.348765619-04:00 level=info msg=“Connecting to DB” dbtype=sqlite3
logger=migrator t=2022-06-30T08:48:31.384123331-04:00 level=info msg=“Starting DB migrations”
logger=migrator t=2022-06-30T08:48:31.387922166-04:00 level=info msg=“Executing migration” id=“Add isPublic for dashboard”
logger=migrator t=2022-06-30T08:48:31.447269639-04:00 level=info msg=“Executing migration” id=“add current_reason column related to current_state”
logger=migrator t=2022-06-30T08:48:31.455418567-04:00 level=info msg=“Executing migration” id=“create alert_image table”
logger=migrator t=2022-06-30T08:48:31.461628102-04:00 level=info msg=“Executing migration” id=“add unique index on token to alert_image table”
logger=migrator t=2022-06-30T08:48:31.474856111-04:00 level=info msg=“Executing migration” id=“create secrets table”
logger=migrator t=2022-06-30T08:48:31.479129621-04:00 level=info msg=“Executing migration” id=“rename data_keys name column to id”
logger=migrator t=2022-06-30T08:48:31.49040246-04:00 level=info msg=“Executing migration” id=“add name column into data_keys”
logger=migrator t=2022-06-30T08:48:31.496406272-04:00 level=info msg=“Executing migration” id=“copy data_keys id column values into name”
logger=migrator t=2022-06-30T08:48:31.49969844-04:00 level=info msg=“Executing migration” id=“rename data_keys name column to label”
logger=migrator t=2022-06-30T08:48:31.50634159-04:00 level=info msg=“Executing migration” id=“rename data_keys id column back to name”
logger=migrator t=2022-06-30T08:48:31.520901794-04:00 level=info msg=“Executing migration” id=“teams permissions migration”
logger=migrator t=2022-06-30T08:48:31.581431692-04:00 level=info msg=“Executing migration” id=“dashboard permissions”
logger=migrator t=2022-06-30T08:48:31.599893922-04:00 level=info msg=“Executing migration” id=“dashboard permissions uid scopes”
logger=migrator t=2022-06-30T08:48:31.617876082-04:00 level=info msg=“Executing migration” id=“drop managed folder create actions”
logger=migrator t=2022-06-30T08:48:31.623756258-04:00 level=info msg=“Executing migration” id=“alerting notification permissions”
logger=migrator t=2022-06-30T08:48:31.633836636-04:00 level=info msg=“Executing migration” id=“add column org_id in query_history_star”
logger=migrator t=2022-06-30T08:48:31.642047195-04:00 level=info msg=“Executing migration” id=“create entity_events table”
logger=migrator t=2022-06-30T08:48:31.65026932-04:00 level=info msg=“Executing migration” id=“create dashboard public config v1”
logger=migrator t=2022-06-30T08:48:31.662147003-04:00 level=info msg=“Executing migration” id=“create index UQE_dashboard_public_config_uid - v1”
logger=migrator t=2022-06-30T08:48:31.667231106-04:00 level=info msg=“Executing migration” id=“create index IDX_dashboard_public_config_org_id_dashboard_uid - v1”
logger=migrator t=2022-06-30T08:48:31.670796455-04:00 level=info msg=“Executing migration” id=“create default alerting folders”
logger=migrator t=2022-06-30T08:48:31.673890407-04:00 level=info msg=“Executing migration” id=“create file table”
logger=migrator t=2022-06-30T08:48:31.677731984-04:00 level=info msg=“Executing migration” id=“file table idx: path natural pk”
logger=migrator t=2022-06-30T08:48:31.681599876-04:00 level=info msg=“Executing migration” id=“file table idx: parent_folder_path_hash fast folder retrieval”
logger=migrator t=2022-06-30T08:48:31.693266391-04:00 level=info msg=“Executing migration” id=“create file_meta table”
logger=migrator t=2022-06-30T08:48:31.70872836-04:00 level=info msg=“Executing migration” id=“file table idx: path key”
logger=migrator t=2022-06-30T08:48:31.724573019-04:00 level=info msg=“Executing migration” id=“set path collation in file table”
logger=migrator t=2022-06-30T08:48:31.728350086-04:00 level=info msg=“Executing migration” id=“managed permissions migration”
logger=migrator t=2022-06-30T08:48:31.74169055-04:00 level=info msg=“Executing migration” id=“managed folder permissions alert actions migration”
logger=migrator t=2022-06-30T08:48:31.760844036-04:00 level=info msg=“Executing migration” id=“RBAC action name migrator”
logger=migrator t=2022-06-30T08:48:31.769153677-04:00 level=info msg=“Executing migration” id=“Add UID column to playlist”
logger=migrator t=2022-06-30T08:48:31.773261164-04:00 level=info msg=“Executing migration” id=“Update uid column values in playlist”
logger=migrator t=2022-06-30T08:48:31.776106981-04:00 level=info msg=“Executing migration” id=“Add index for uid in playlist”
logger=migrator t=2022-06-30T08:48:31.780173712-04:00 level=info msg=“migrations completed” performed=33 skipped=392 duration=392.4223ms
logger=plugin.manager t=2022-06-30T08:48:31.810958242-04:00 level=info msg=“Plugin registered” pluginId=input
logger=secrets t=2022-06-30T08:48:31.811348746-04:00 level=info msg=“Envelope encryption state” enabled=true currentprovider=secretKey.v1
…
Consecutive restarts says no migrations needed
logger=sqlstore t=2022-06-30T09:25:21.877831304-04:00 level=info msg=“Connecting to DB” dbtype=sqlite3
logger=migrator t=2022-06-30T09:25:21.905479729-04:00 level=info msg=“Starting DB migrations”
logger=migrator t=2022-06-30T09:25:21.910890853-04:00 level=info msg=“migrations completed” performed=0 skipped=425 duration=654.489µs
logger=plugin.manager t=2022-06-30T09:25:21.943313159-04:00 level=info msg=“Plugin registered” pluginId=input
- Did you follow any online instructions? If so, what is the URL?