Grafana 10.2.3 since before Christmas and notice this issue now
Grafana running on site on Windows Server 2019
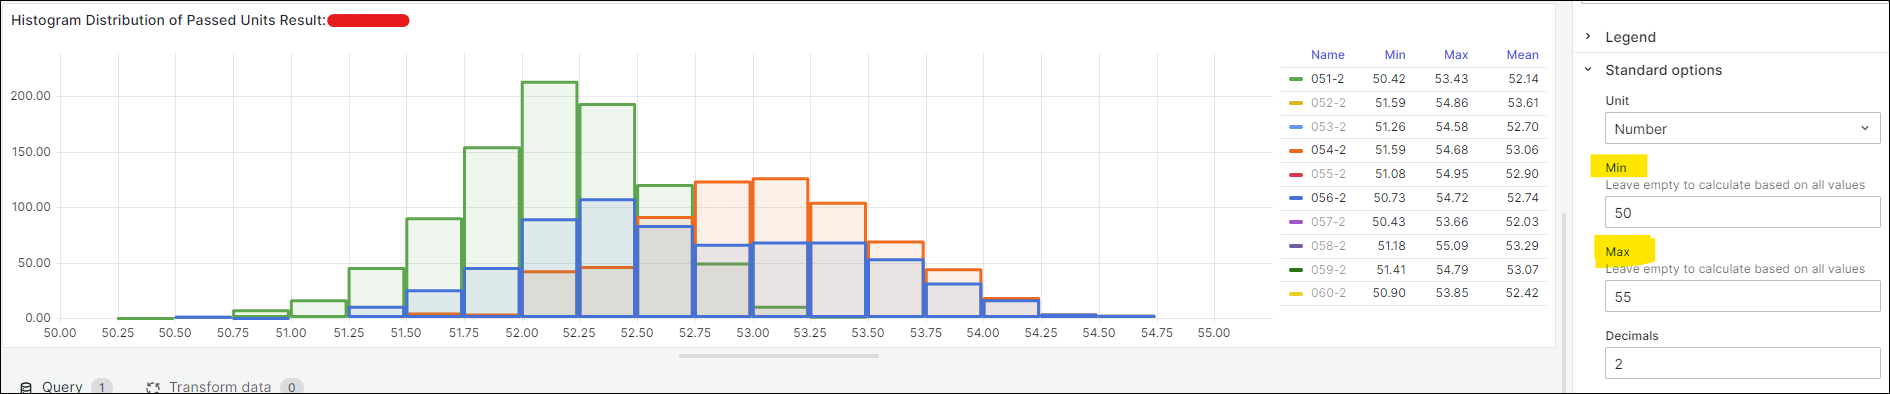
Load up Histogram on Pages, as time series with time, metric and value and this is what I get
No Grafana Errors when showing blank Graph, shows legend counts highlighted in yellow

Red marker is for a result column you’d choose to view in the various graphs on this dashboard, Query is manual SQL and variables from top changing the views, not perfect but it did work
Panel doesn’t work unless manually setting Min and Max values for X Axis
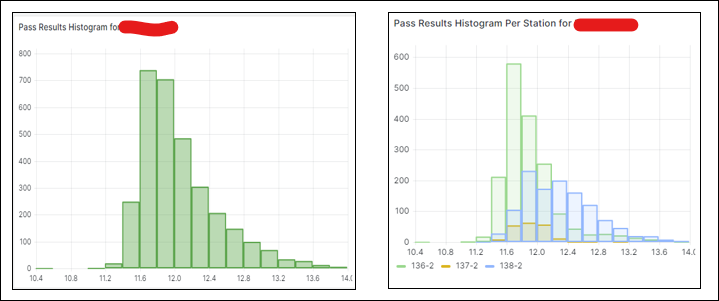
Was working before like below ( different Dashboard but same idea )
Breaks and crashes for memory, Gets this error on latest version of Edge and similar on Chrome

Checked for other topics and rechecked the documentation but nothing
Any help is appreciated, thanks!
