Hi everyone,
I’m trying to visualize the latest voltage values from 120 battery cells in a histogram. The idea is that the histogram bars (i.e., value counts per bucket) should always sum up to 120, since there are always 120 individual voltage readings – one per cell.
To achieve this, I’m using the last() transformation to ensure I’m working only with the latest value from each cell.
However, the problem is:
The histogram bar values do not sum to 120, even though each cell is reporting values correctly in the backend.
My setup:
- Data source: [InfluxDB / NodeRed / MQTT ]
- Each battery cell reports a voltage value.
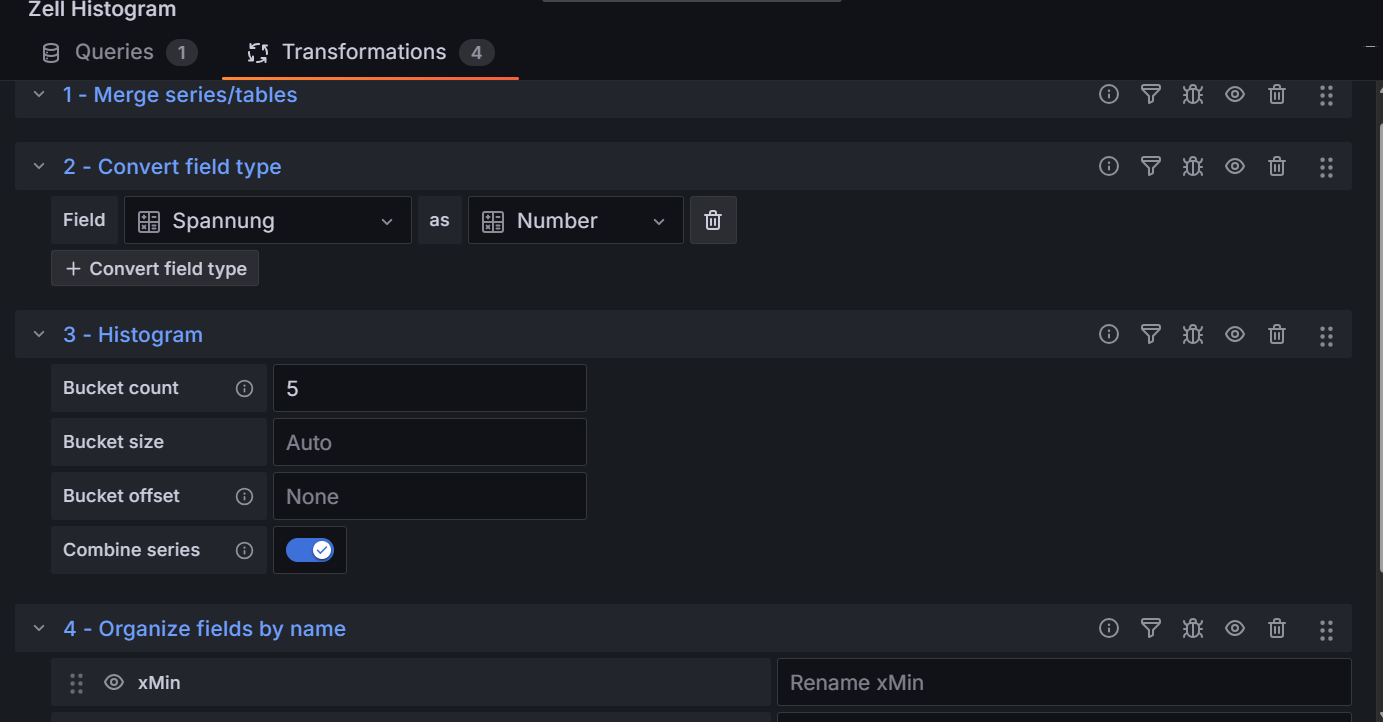
- In the Transform tab, I apply
last()to get the latest value from each cell. - The result is fed into the Histogram visualization.
- Standard options: all default, no extra filtering.
What I expect:
- 120 values → Histogram bins should add up to 120 (i.e., total count of all bars).
What happens:
- Total histogram count is less than 120.

from(bucket: “Batterieschrank_Zellen”)
|> range(start: -30d)
|> filter(fn: (r) => r.measurement =~ /^Zelle(0\d{2}|1[01]\d|119)$/)
|> filter(fn: (r) => r._field == “Spannung”)
|> last()