a99
November 29, 2017, 4:29am
1
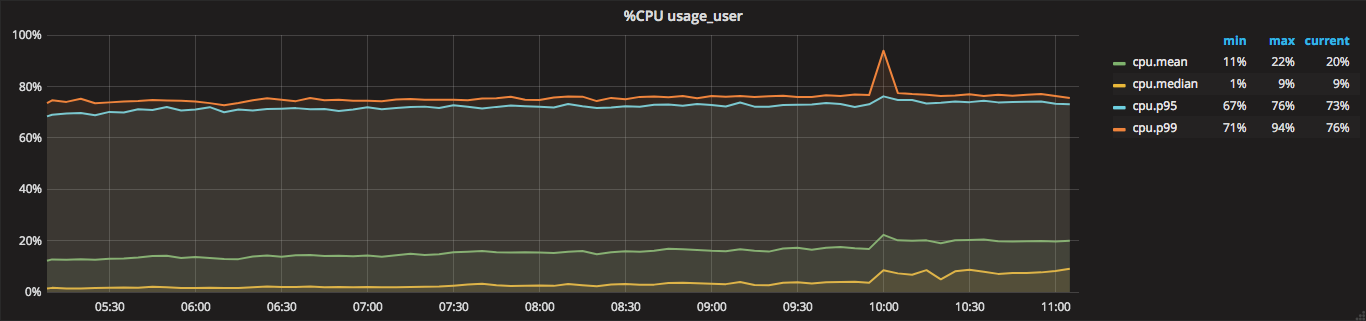
Hi, I’m using Grafana 4.6.2 with InfluxDB 1.2.4. When I created a graph for CPU’s usage_user, the differences between mean, median, and percentile are huge as you can see in my screenshot below
My query looks like:
SELECT mean("usage_user") FROM "cpu" WHERE ("user" = 'SRV-001') AND $timeFilter GROUP BY time($__interval) fill(null)
Where data was grouped by 5 minutes.
Hi,
Are you using telegraf for collecting cpu usage?
Marcus
a99
December 1, 2017, 9:42am
3
Yes, I’m using telegraf to collect metrics.
I would suggest you to download community built dashboards and either use those straight away or take some inspiration to build your own.
One example which seems good for your case is this one . You can find more dashboard there if you search for telegraf and influxdb.
Marcus
a99
December 1, 2017, 10:09am
5
Thanks. But the problem isn’t about dashboard, it’s the differences if I choose MEAN, MEDIAN, or PERCENTILE.
I don’t think percentile is any good for cpu metrics. Mean is probable what you want in this case.
Which one to choose is up to you.
Please read up on the different influxdb functions:
Marcus