Hello everyone!
I need help configuring Isto’s Virtual service to work with grafana using subpath, I made the necessary settings in grafana.ini
grafana.ini:
  server:
    domain: example.com
    protocol: http
    root_url: "%(protocol)s://%(domain)s/grafana/"
Then I configured the gateway:
apiVersion: networking.istio.io/v1alpha3
kind: Gateway
metadata:
  name: grafana-gateway
  namespace: monitoring
spec:
  selector:
    istio: ingressgateway
  servers:
  - port:
      number: 80
      name: http-grafana
      protocol: HTTP
    hosts:
    - "example.com"
    tls:
      httpsRedirect: true
  - port:
      number: 443
      name: https-grafana
      protocol: HTTPS
    tls:
      mode: SIMPLE
      credentialName: istio-system/prometheus-tls
    hosts:
    - "example.com"
To finish, I configured the virtual service:
apiVersion: networking.istio.io/v1alpha3
kind: VirtualService
metadata:
  name: grafana-vs
  namespace: monitoring
spec:
  hosts:
  - "example.com"
  gateways:
  - grafana-gateway
  http:
  - match:
    - uri:
        prefix: "/grafana/"
    rewrite:
      uri: "/"
    route:
    - destination:
        host: grafana
        port:
          number: 80
I can access grafana without normally using the UR:

But the dashboards are not being able to transact any Grafana metrics and I noticed that when opening the dashboard the 404 error is returning in the top corner.
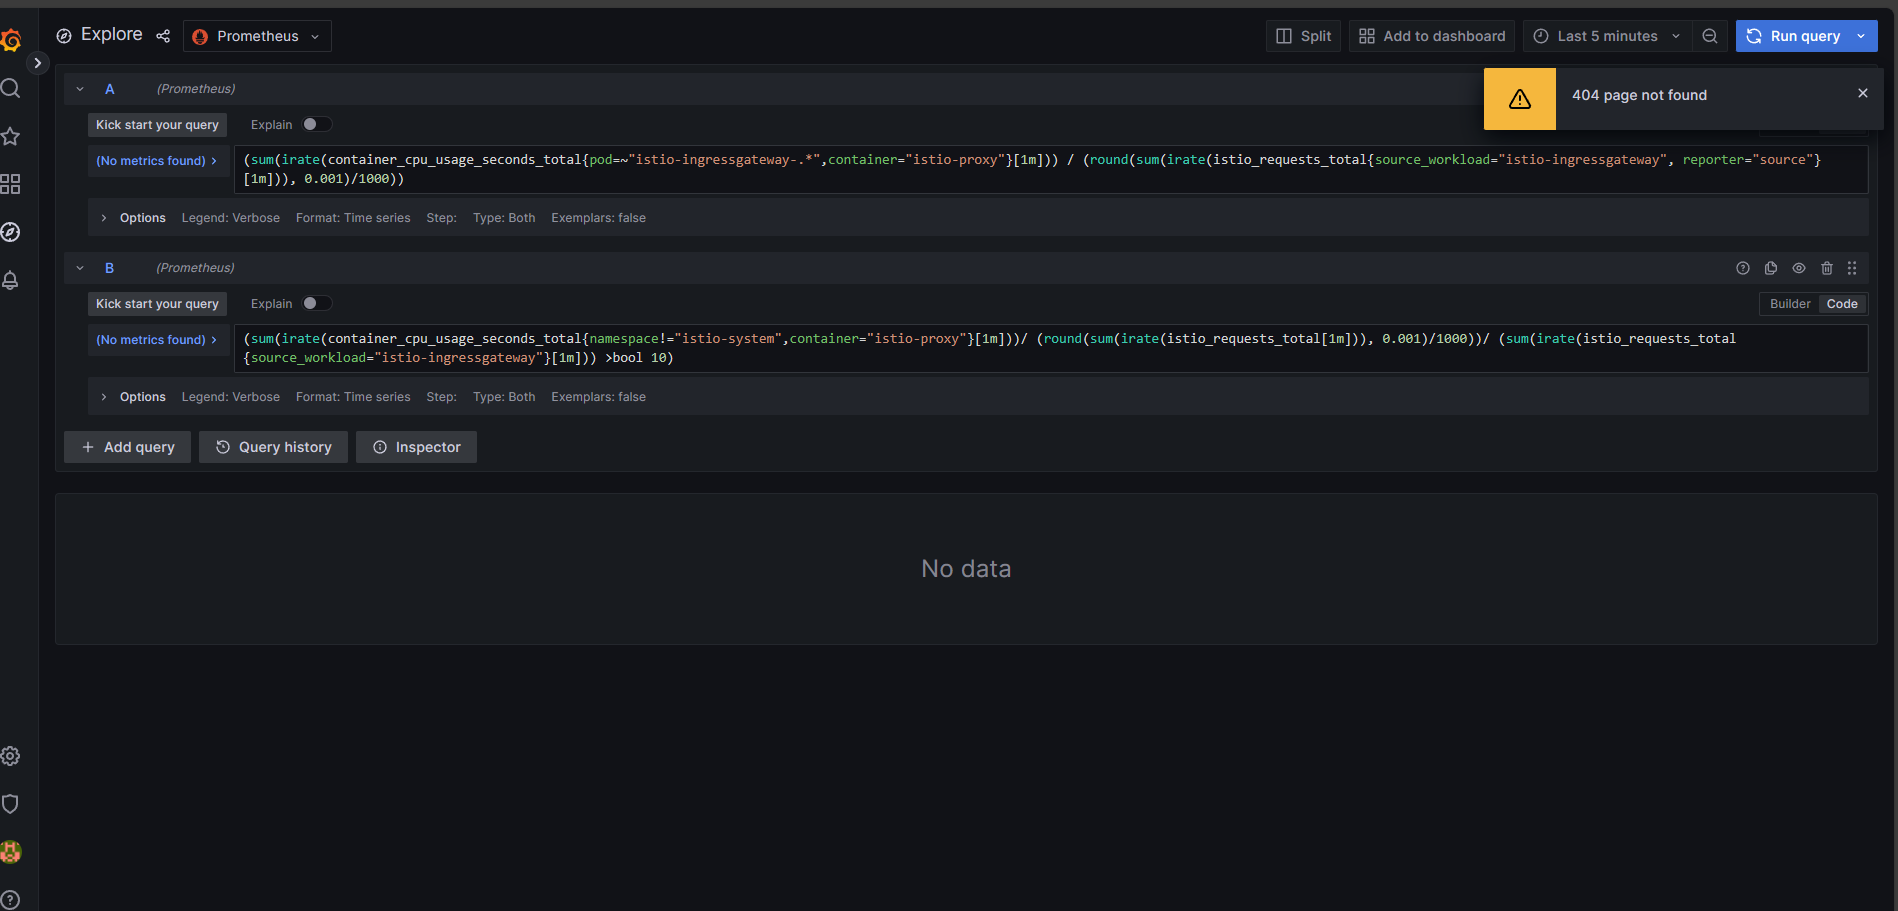
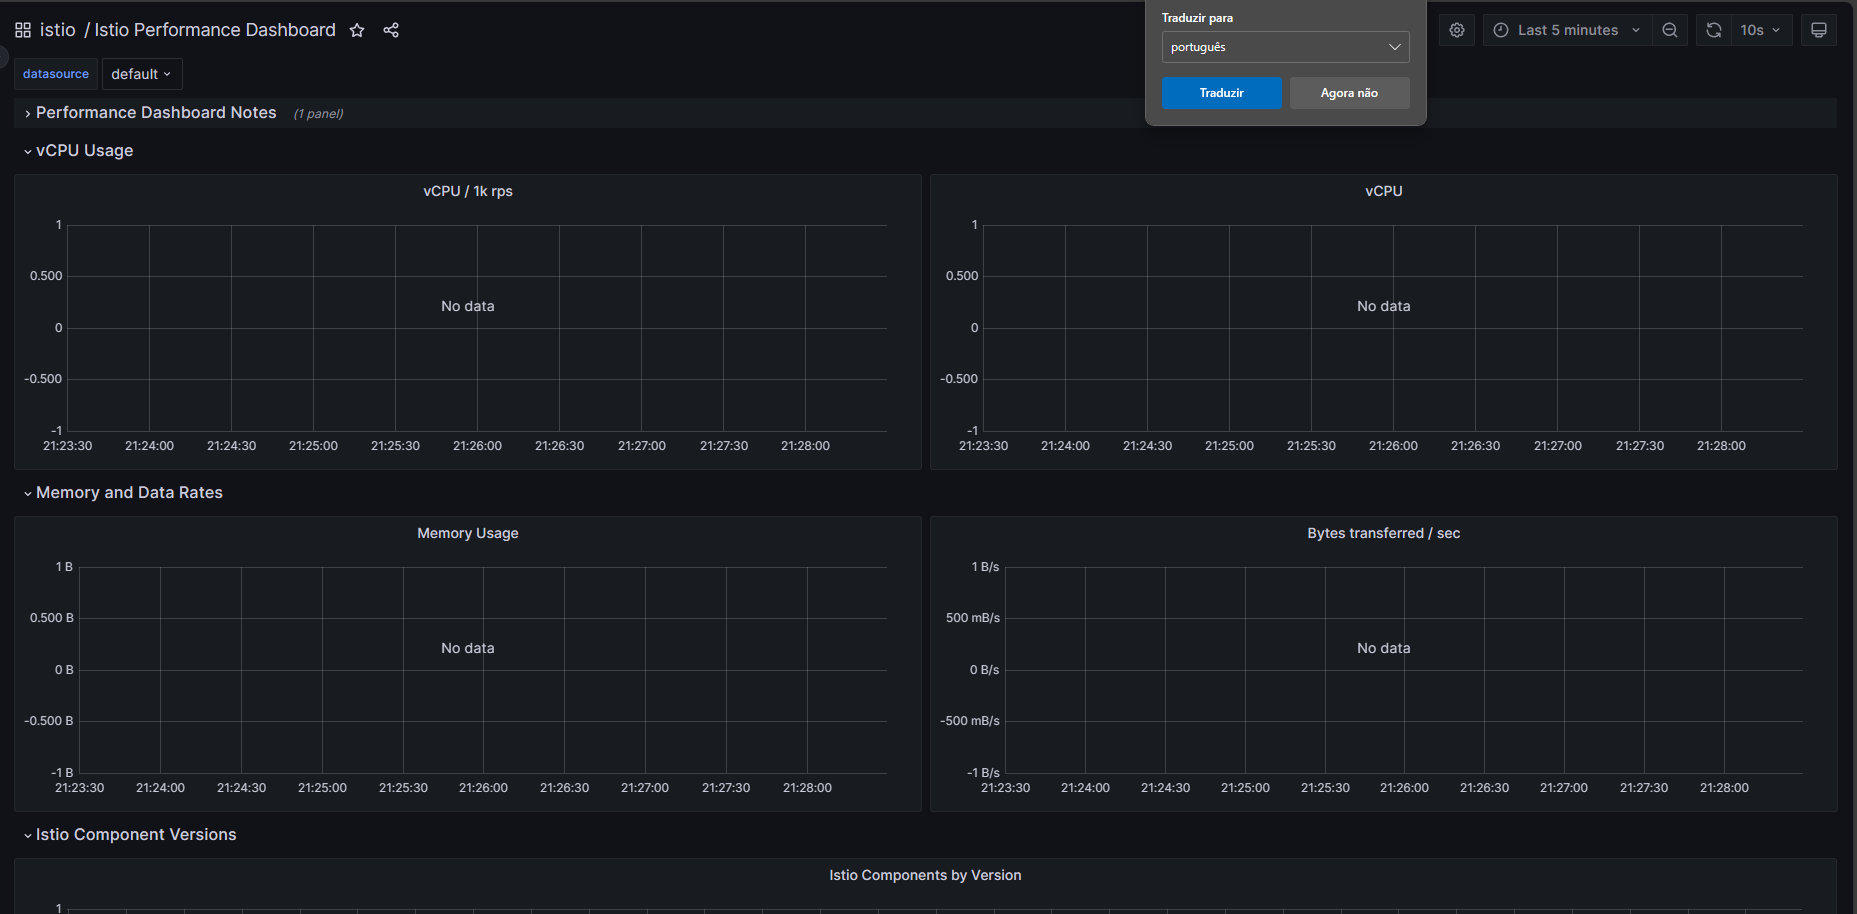
Dashboard cannot display the metrics, in all dashboards it is being displayed “no data”:
I could see in the istio ingress gateway logo that when it tries to access the subpath the error 404 is being returned:
istio-ingressgateway-6fc678d4dd-65hmv istio-proxy {"downstream_local_address":"10.42.0.1:8443","duration":31,"upstream_cluster":"outbound|80||grafana.monitoring.svc.cluster.local","bytes_sent":19,"protocol":"HTTP/2","response_flags":"-","bytes_received":0,"requested_server_name":"meuingress.com","method":"GET","upstream_service_time":"31","connection_termination_details":null,"upstream_host":"10.32.0.7:3000","response_code_details":"via_upstream","upstream_local_address":"10.42.0.1:49688","path":"/grafana/api/datasources/uid/PBFA97CFB590B2093/resources/api/v1/metadata","request_id":"00bd3993-01a2-4597-b007-59c0479794d1","authority":"meuingress.com","user_agent":"Mozilla/5.0 (Windows NT 10.0; Win64; x64) AppleWebKit/537.36 (KHTML, like Gecko) Chrome/119.0.0.0 Safari/537.36 Edg/119.0.0.0","start_time":"2023-11-06T00:22:48.338Z","upstream_transport_failure_reason":null,"response_code":404,"downstream_remote_address":"10.46.0.0:23714","route_name":null,"x_forwarded_for":"10.46.0.0"}
And in the grafana log:
grafana-6884c5f67f-n2xdt grafana logger=context userId=1 orgId=1 uname=admin t=2023-11-06T00:20:52.8322234Z level=info msg="Request Completed" method=GET path=/api/datasources/uid/PBFA97CFB590B2093/resources/api/v1/labels status=404 remote_addr=10.46.0.0 time_ms=35 duration=35.5863ms size=19 referer="https://meuingress.com/grafana/explore?left=%7B%22datasource%22%3A%22PBFA97CFB590B2093%22%2C%22queries%22%3A%5B%7B%22expr%22%3A%22sum%28istio_build%7Bcomponent%3D%5C%22pilot%5C%22%7D%29+by+%28tag%29%22%2C%22format%22%3A%22time_series%22%2C%22intervalFactor%22%3A1%2C%22refId%22%3A%22A%22%2C%22datasource%22%3A%7B%22type%22%3A%22prometheus%22%2C%22uid%22%3A%22PBFA97CFB590B2093%22%7D%2C%22interval%22%3A%22%22%7D%5D%2C%22range%22%3A%7B%22from%22%3A%22now-5m%22%2C%22to%22%3A%22now%22%7D%7D&orgId=1" handler=/api/datasources/uid/:uid/resources/*
I believe it is some configuration in the virtual service that I don’t know how to do and I would be grateful if someone could give me some tips or documentation on how I can solve it.