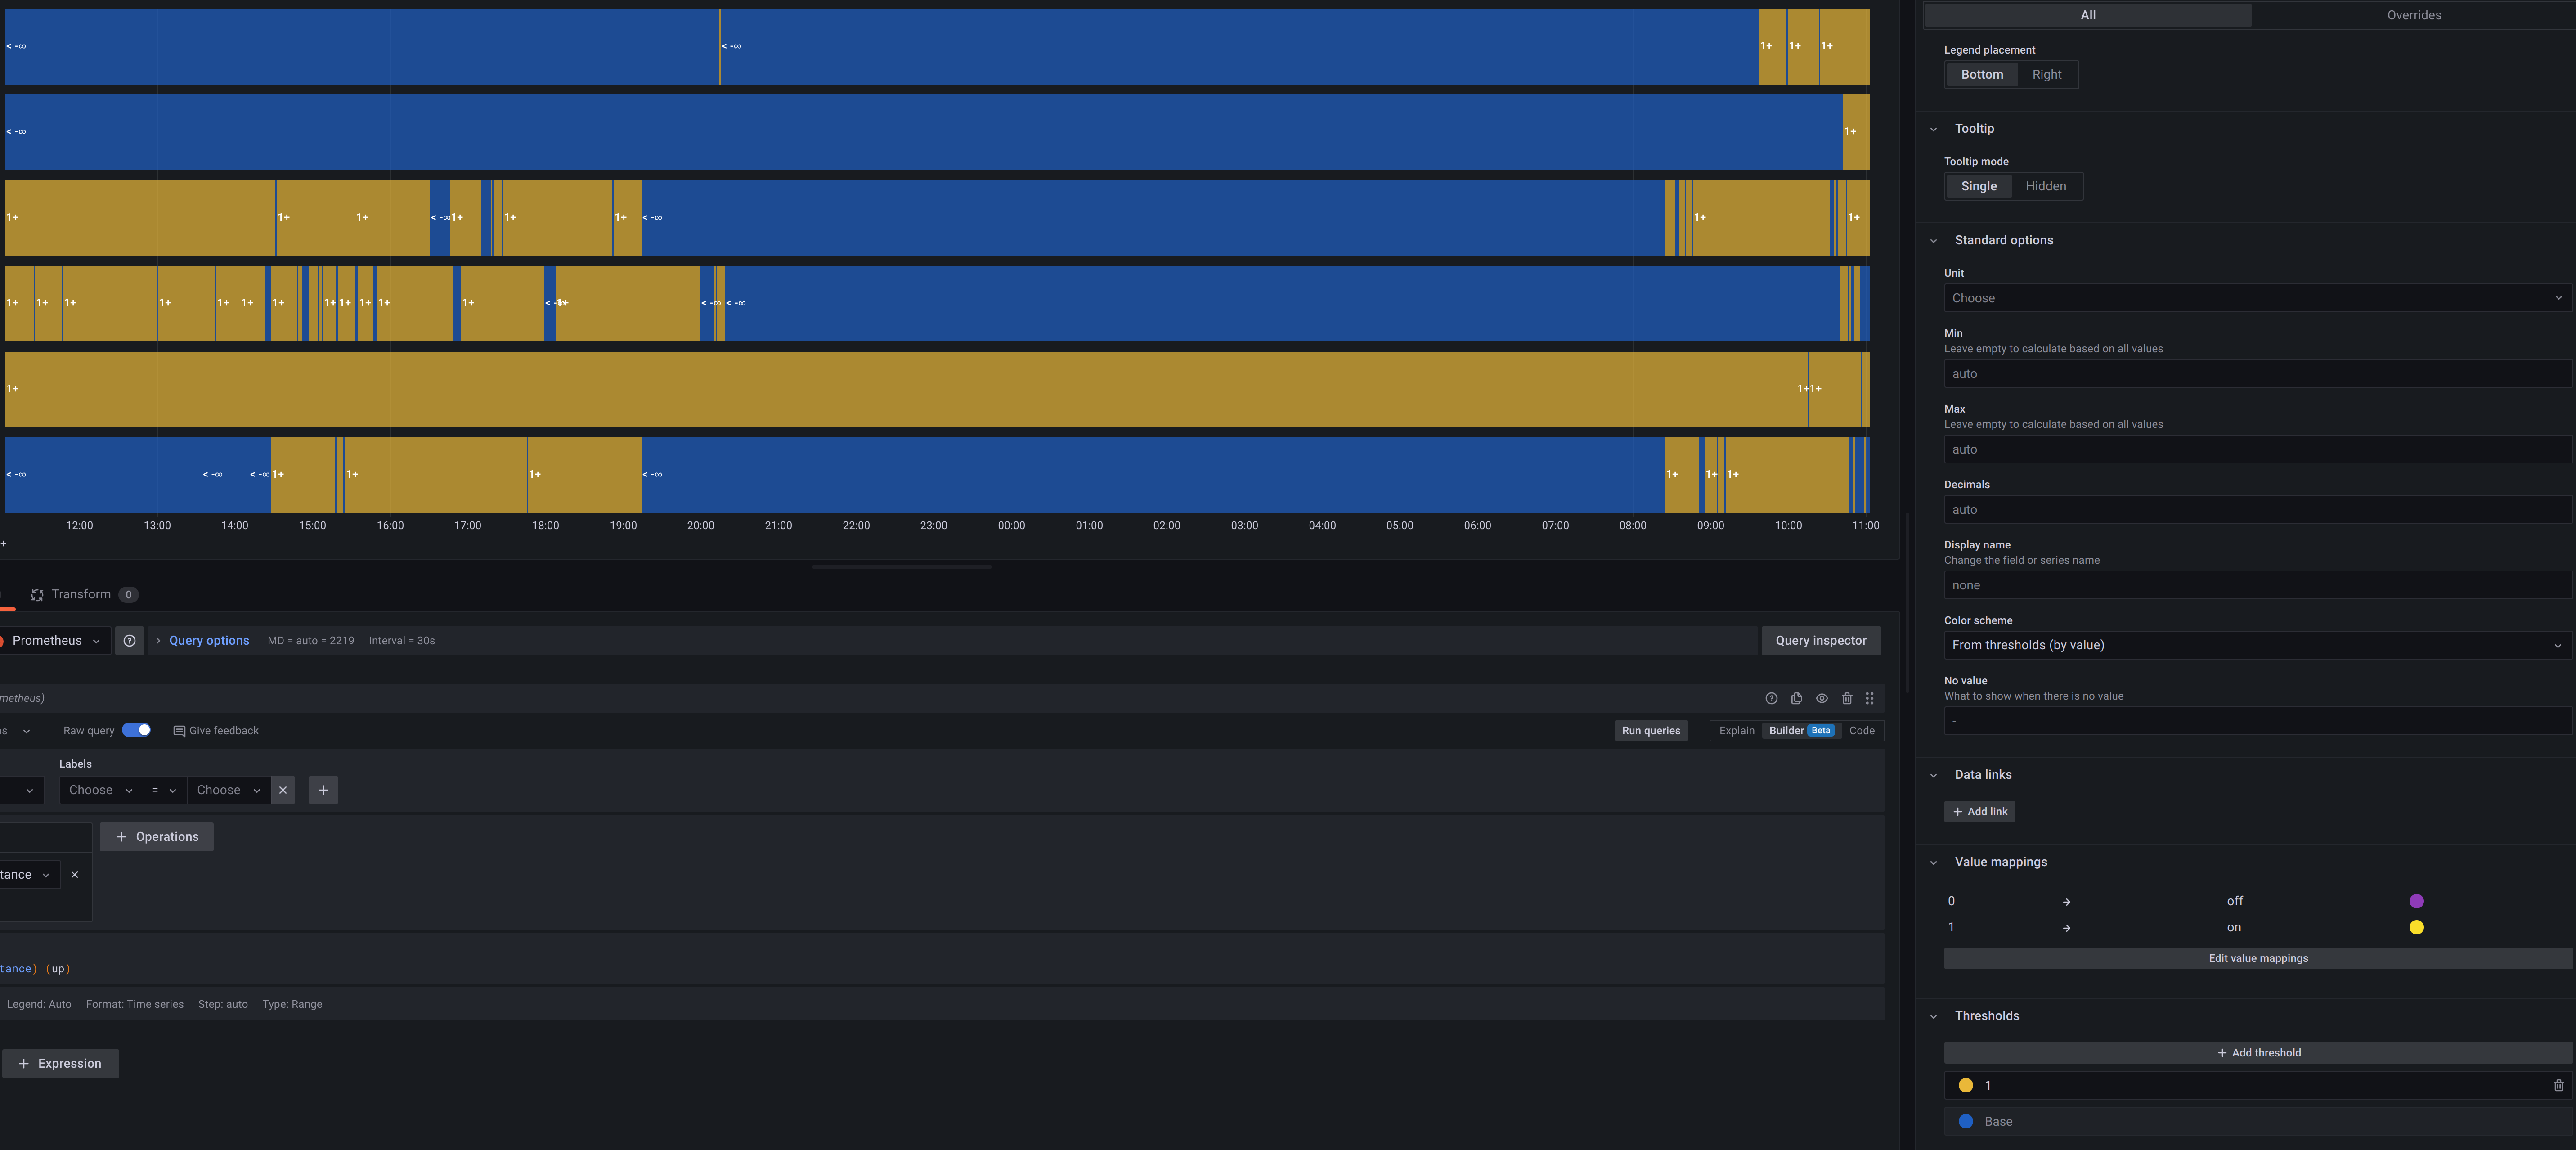
I have a graph like below, where multiple series have the exact same value (it’s a usage graph where each series is either 1 or 0, so the values exactly match).
When rendered, the lines are overlayed over eachother, with one line on top and the others under it invisible. It is impossible to tell the values of the hidden lines. In the picture below the yellow line is the same as the blue line, but it’s impossible to tell that.
Is there some setting that would make it more visible where each line is?
When I hover over a point, it just shows me the value of one of the series. It would be helpful if when I hovered over a point it would highlight all of the series which are at that point.