I send to influx 1 data per day, and when I want to change time interval for using weeks, I have as wanted one datapoint every week, but this datapoint comes every thursdays.
I would like to have my datapoints on mondays instead of thursday, but I don’t understand logic behind the scene.
Could you please explain me this ?
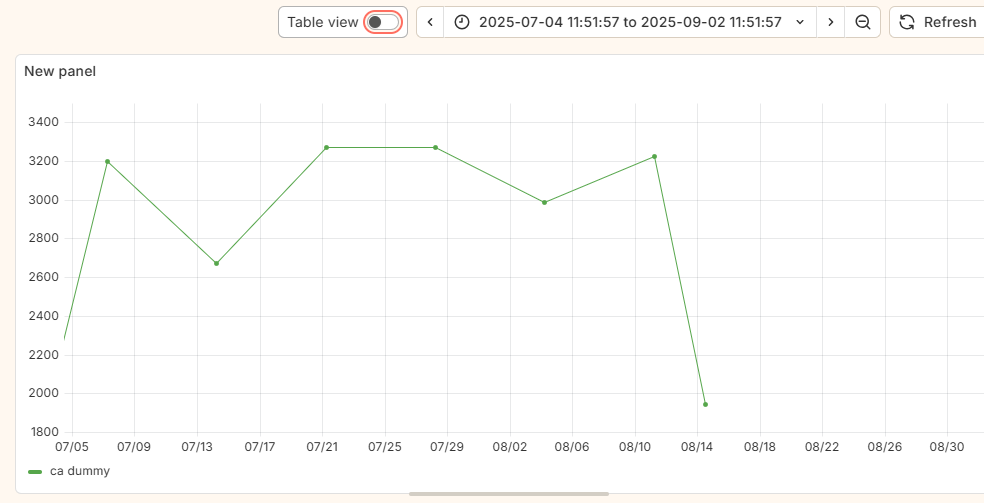
Please find attaches an example.
I guess you are using influxdb. There is a syntax for getting what you want but i think you cant do it with the gui editor. On the right side of the query editor there is the option to switch to edit mode.
You need somethign like the following query:
SELECT sum(ca) FROM gmv AS "Global GMV" GROUP BY time(1w,4d) fill(none)
Do you know hw could I use this syntax as default ? Or at least by the way of the inverval variable ?
I indeed use a variable with custom values : 1d,2d,1w,2w,30d , and it would be great if I could replace my 1w by this updated value, but I can’t find how to do this.
SELECT sum(ca) FROM gmv AS "Global GMV" GROUP BY time($variable,4d) fill(none)
I dont think you can use , in custom variables since thats used to separate single values so you cant put the whole expression in the variable unless you have pull your value list from a different datasource.
I use only days and weeks in my template, so it is not a problem for me to add this into variable queries (excepted I spent some time changing this in every query in my dashboard)
It could be a problem for some people ff they would like to have differents offsets, but it is not our case, so thank you again !
I found out how to use a comma in a variable without splitting it into another option:
You need to escape it with a backslash \.
For example: 1d,1w\,4d,4w\,4d results in 1d1w,4d and 4w,4d.
Hello @toms130
After analyzing the issue, I believe I have identified the underlying problem. Please find below the recommended steps that may help resolve it
Step 1. Create the Bucket and Insert Dummy Data.
Ensure you have created the InfluxDB bucket and inserted the required dummy data to simulate the real use case.

 !
!