Hi, I need some help.
When add Graphite data source and press “Save & Test” I receive “HTTP Error internal server error”
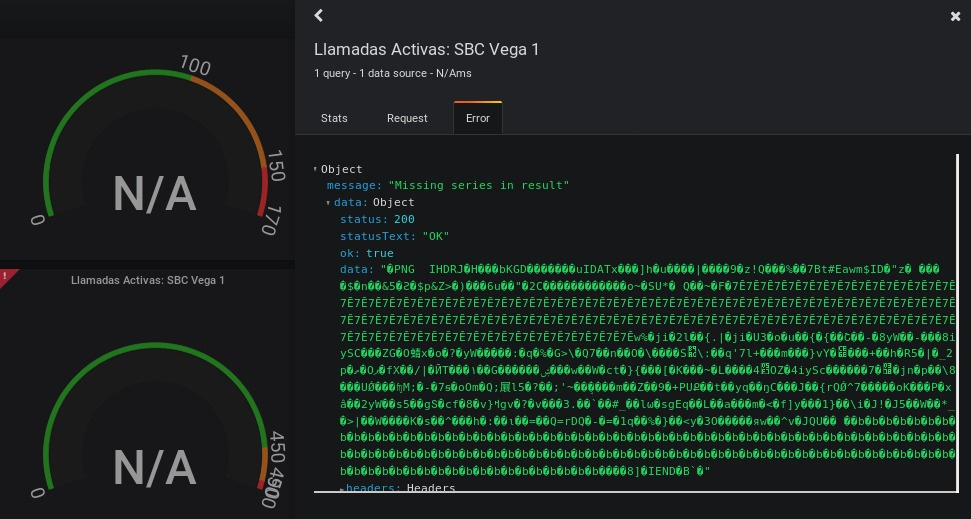
When I create a panel using that data source I can graph that data, but when several users logs and open different dashboards and panels everyone receive the message “Missing series in result” error and “N/A” in all panels and dashboards.
I tried updating the render engine to “grafana-image-renderer” but nothing happened.
Moved the VM to another hypervisor with more resources…
Installed a fresh new Grafana 7.2 and issue persist, so I assume that I missed some setting in Graphite server side.
Thanks in advance for helping.
Grafana version: 6.7.2
Graphite version: 0.9.12-3
/var/log/grafana/grafana.log
=2020-10-01T13:28:11-0300 lvl=eror msg="Request Completed" logger=context userId=38 orgId=2 uname=xxxx method=POST path=/api/datasources/proxy/8/render status=500 remote_addr=x.x.x.x time_ms=579 size=10996 referer=http://domain.com/grafana/datasources/edit/8/
/var/log/apache2/graphite-web_access.log
x.x.x.x - - [01/Oct/2020:13:34:51 -0300] "POST /render HTTP/1.1" 500 11219 "-" "Grafana/6.7.2"
/etc/apache2/sites-enabled/graphite.conf*
<VirtualHost *:8000>
    WSGIDaemonProcess _graphite processes=5 threads=5 display-name='%{GROUP}' inactivity-timeout=120 user=_graphite group=_graphite
    WSGIProcessGroup _graphite
    WSGIImportScript /usr/share/graphite-web/graphite.wsgi process-group=_graphite application-group=%{GLOBAL}
    WSGIScriptAlias / /usr/share/graphite-web/graphite.wsgi

    Alias /content/ /usr/share/graphite-web/static/
    <Location "/content/">
            SetHandler None
    Header Set Access-Control-Allow-Origin "*"
    </Location>

    ErrorLog ${APACHE_LOG_DIR}/graphite-web_error.log

    # Possible values include: debug, info, notice, warn, error, crit,
    # alert, emerg.
    LogLevel warn

    CustomLog ${APACHE_LOG_DIR}/graphite-web_access.log combined
# grafana-cli plugins ls
  installed plugins:
  briangann-gauge-panel @ 0.0.6
  btplc-peak-report-panel @ 0.2.4
  digiapulssi-organisations-panel @ 1.1.0
  grafana-clock-panel @ 1.0.3
  grafana-image-renderer @ 2.0.0
  grafana-piechart-panel @ 1.3.9
  savantly-heatmap-panel @ 0.2.0
  snuids-trafficlights-panel @ 1.4.5
  vonage-status-panel @ 1.0.9