How can I get a graph containing the number of log statements for each hour during a day. Typically I want to represent this as a bar graph with one bar for each hour of the day.
For example:
00-01: 100 occurences
01-02: 98
…
23-24: 76
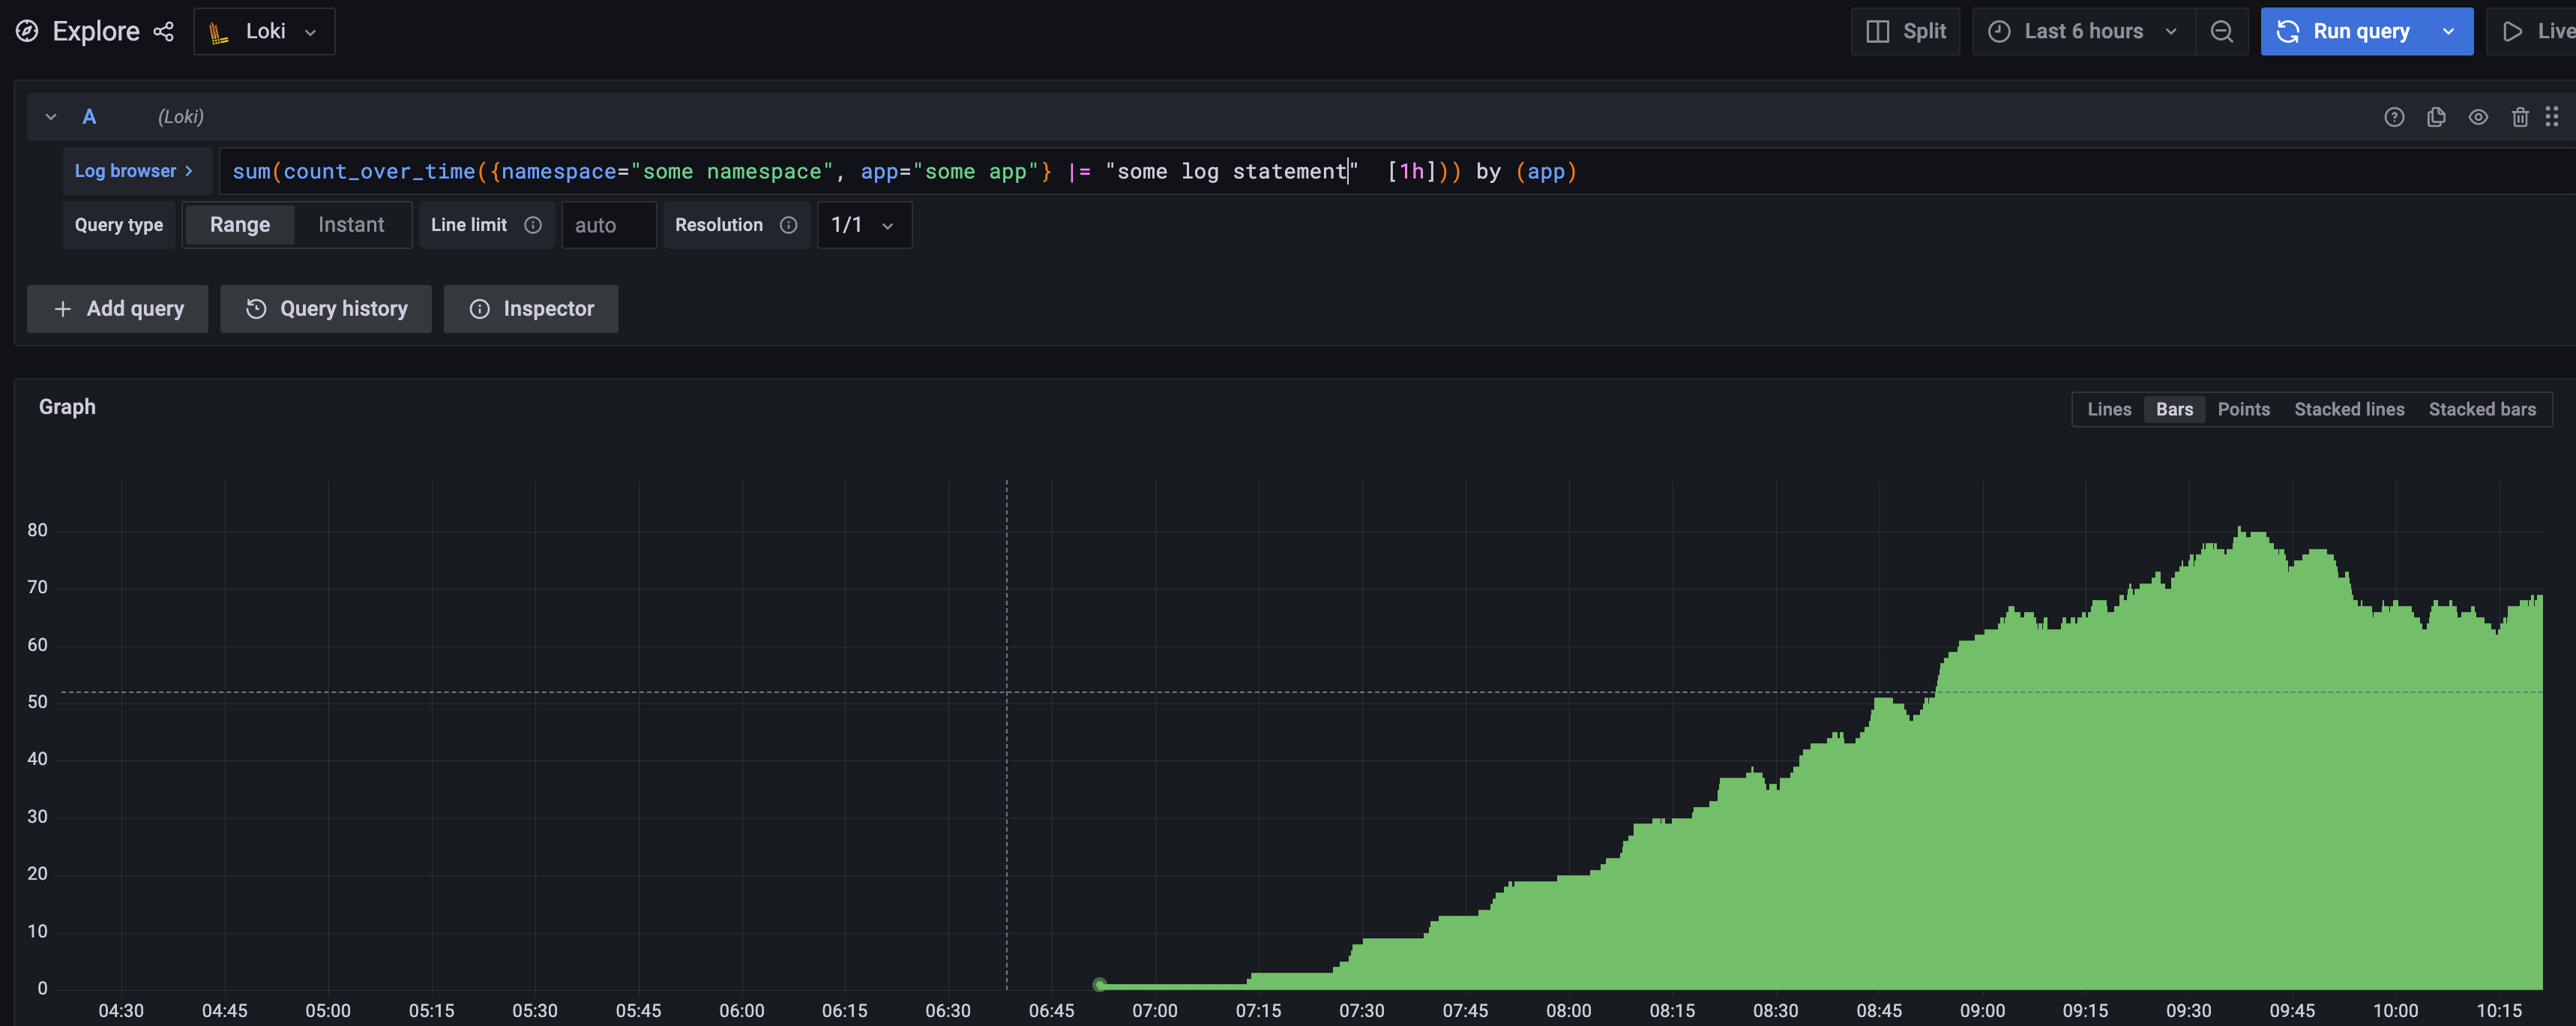
I have added a screenshot showing what I have so far, but the problem is that this is showing me the number of occurences for the last hour from every point in the graph. See attached image to understand what I mean.
This is my current query;
sum(count_over_time({namespace="some namespace", app="some app"} |= "some log statement" [1h])) by (app)