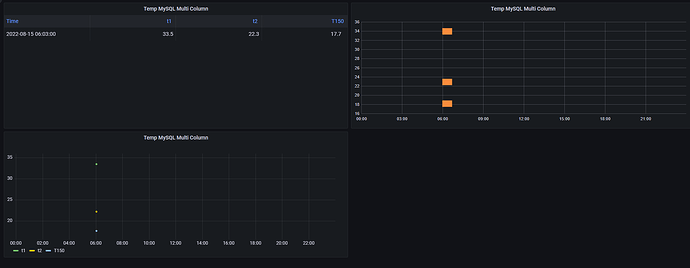
Hi!
Using Grafana v8.5.5 and MySQL (MariaDB) I’d like to display a simple table in different ways. In the table, I store temperature values from ~ 150 different measuring points inside a storage building. The table is structured fairly simple like this:
ID - DATETIME - T1 - T2 - T3 - Tn (…)
1 - 2022-08-10 08:00:00 - 19 - 20 - 18.5 - (…)
1 - 2022-08-11 09:30:00 - 18 - 20 - 19 - (…)
What I would like to do is to display these data points in different ways:
- As a table, just like I am able to view it in phpMyAdmin
- As a graph, displaying all measuring points on the x Axis - (either just 1 row / date) at a time or aggregated
- As a heatmap (the temperature measuring points are aligned in a grid)
I have no idea how I am able to display multiple value columns in Grafana. Please help 
Thank you!
Welcome
Please post the table schema as follows
Create table sample
(
Readdate datetime,
T1 float,
T2 float
)
Etc
Why did you decide on this multi column table?
Thanks for your reply!
Okay, then, the table looks like this:
Create table temperatures
(
Id int,
Readdate datetime,
T1 float,
T2 float,
T(n) float,
T150 float
)
I put all temperature values into one table because of usability reasons. I am not sure if this needs to be normalized. But in this form, it is easy to enter new records via a db management tool. Also I need to print the data as a table over multiple pages.
What would be the alternative? 150 tables - one for each measuring point? If Grafana is in need of multiple tables to plot this data, maybe I’d be able to split the table into multiple tables via SELECT?
Again, thanks for your help!
so if you have a brand new location you will then add a new column?
I would go with this approach
create table temperatures
(
location varchar(50),
temperature float,
readdate datetime)
2 Likes
Thank you for that suggestion, that looks very reasonable! I will, however, have slightly more difficulty inputting the data. As I said, with my table structure, I can easily enter the values as I have read them via phpMyAdmin. With your suggestion, I have to manually input the location and readdate for every value… This would need some sort of php entry form alongside, or do you have a clever idea for that, too? The temperatures for all 150 locations are read once weekly, so the readdate can be the same for all locations within this timeframe.
Or - maybe - is the a way to SELECT my data in a way that it outputs it in your style?
Thank you!
1 Like
Cool. Yes you can do that by using pivot.
Okay, so I quickly googled how I could do pivot within a mysql db. Seems as if it isn’t that easy, done with a CASE for every column that shall be turned into a row. That would need 150 cases, wouldn’t it? I’m not sure I want to do that. Either there is an easier way or I will go the route creating a PHP form to enter the values into a table structured your way.
No need to. Just gobwith the design you have and you can still plot the data
Okay, now you’ve got me confused… 
If you mean my original design
Create table temperatures
(
Id int,
Readdate datetime,
T1 float,
T2 float,
T(n) float,
T150 float
)
Then we are back to my original question. How do I plot the values?
If Grafana needs the data in the way you structured it:
Create table sample
(
Readdate datetime,
T1 float,
T2 float
)
…then how can I transform my table format into yours?
Thank you!
Thank you very much! Problem solved. Really never hasn’t been a problem :-D.
2 Likes
![]()
