I have tried searching the forums and Google for this with no joy  .
.
Basically we changed to British Summer Time (UTC - 1 hour) at the weekend and since then all our Grafana timegroup graphs are off by an hour. Also any formatting to datetime formats is off by the same.
All servers are in BST and align, SQL databases all use BST returned back from the datetime columns but the Grafana time graphing is not returning the BST time when converting back from seconds since 1970 etc.
Help!
-
Are the timestamps stored in the database as UTC? This is an essential
requirement for Grafana. -
Do you notice the problem for all data, both last week’s and this week’s,
or is the problem only apparent for one of those?
Regards,
Antony.
The databases store using datetime format in SQL and as these are terabytes databases we have no control over the column formats. All times are listed from SQL as that expected by BST while Grafana is assuming GMT.
The databases store using datetime format in SQL and as these are terabytes databases we have no control over the column formats. All times are listed from SQL as that expected by BST while Grafana is assuming GMT.
it would appear that Grafana has no allowance for BST in the GMT timezone?
It isn’t that “Grafana has no allowance for BST in the GMT timezone”; Grafana
simply requires all database timestamps to be in UTC, because otherwise this
causes problems such as:
a) the ones you have experienced since the weekend
b) a 1 hour gap when clocks go forward in March (which I guess many people
could live with), and also…
c) a 1 hour set of duplicate timestamps when clocks go backward in October
(which I image almost every monitoring system would have a big problem in
sensibly representing).
So, it isn’t that Grafana doesn’t support summertime / daylight saving time
changes; it’s just that anything other than UTC for continuous measurements in
a time-series database causes problems.
Regards,
Antony.
Thanks Antony.
It’s a bit of a mess for us as Grafana is producing timefilters that are an hour out against the SQL data.
If I run a simple graph with time group and filters now (15:49 BST) then Grafana produces this SQL…
SELECT
Count([MessageId]) As ‘All requests per minute’,
FLOOR(DATEDIFF(second, ‘1970-01-01’, [CreatedDate])/60)*60 as time
FROM
Messaging.Message (NOLOCK)
WHERE
[CreatedDate] BETWEEN ‘2020-03-31T08:49:44Z’ AND ‘2020-03-31T14:49:44Z’
GROUP BY FLOOR(DATEDIFF(second, ‘1970-01-01’, [CreatedDate])/60)*60
which is an hour out on the filter as like you said it only works for UTC timestamps and not the default SQL use of datetime and datetime2.
I can get around it maybe by creating a temp table and amend the datetime to be UTC in the results from it.
What is a terabyte database? It is not the database format but the data being given to it.
If it worked the way you want what would you expect to see at 02:00 when the clocks go back?
I don’t know mssql at all but I wonder whether the 1970-0-01 is assuming you mean local time. Will it accept
FLOOR(DATEDIFF(second, ‘1970-01-01T00:00:00Z’, [CreatedDate])/60)*60
It’s generated all from within the __timegroup and __timefilter macros so we have no control over that unfortunately. Also it only displays the graphs in UTC so they are useless to us in the UK
I can’t present this graph to an end user and start telling them you need to add an hour to the graph times to get the correct time.
I will create my own SQL using the $to and $from dates and work the seconds from 1970 correctly from BST but it a bit of a lack of proper support for SQL Server to be honest but with maximum effort I’ll get it to work.
Can I just check one thing. On the graph, ignore the data for the moment, is the correct local time shown on the axis at the right hand side of the graph? If it is not then we have misinterpreted the problem.
For example if I ask for the last 5 minutes it shows the last 5 - 1 hour, so the end time is for example 17:00 but the graph shows 16:00 as the last time.
Grafana has generated the correct UTC time but as SQL is storing in datetime format it has the BST one. I can work around it maybe by using the $to and $from variables and adding in the BST hours.
There is another issue as one user who has their PC set up the same as the others is seeing the time to the end of the last 5 minutes but the data is shift right so the data doesn’t match the hours etc.
terabytes as in 5TB in size for one and the others are all over 1TB in size too so no chance of adding a timestamp etc. so we only have the datetime columns to work with.
The bigger problem is that the graph axis always is shown in UTC which is confusing the hell out of the users looking at it, it was fooling us thinking it was displayed in local time before the DST/BST change and then it became apparent that the graphs only have UTC on the axis.
I tried fooling the graph by altering the timestamps returned but somewhere within the code it is basing the graph on the “expected” graph range so you still have the same problem with a blank section at the left and a missing hour section at the right side
Still not quite sure it is clear. If the local time is 17:00 when you bring the chart up showing the last 5 minutes, for example, is the time written under that chart at the right hand side 16:00?
If that is true then the data in the database is correctly in UTC. The problem is that for some reason the chart is not being corrected for local time.
First check the timezone in the machine running the browser. If that is set to gmt instead of GMT BST then you will get that problem.
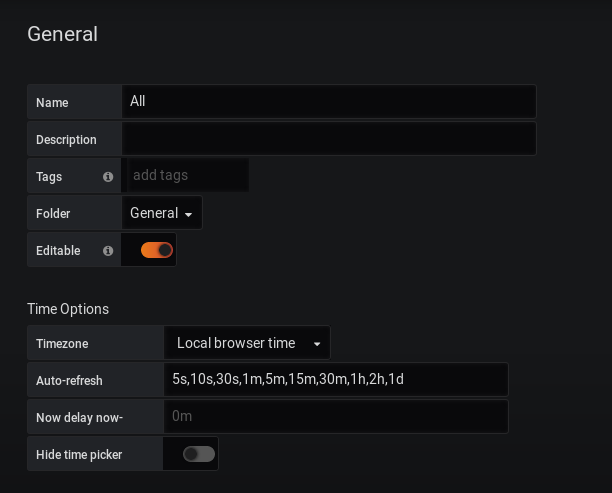
Secondly check the dashboard settings (the settings cog in the top bar of the dashboard and make sure you have Timezone set to Local browser time
Did all of that but made no difference, if I use UTC time it is 2 hours out lol. I got around the problem by defaulting the time range from now to now+1hr and all is sweet again but it does seem to be an issue around Grafana. Also what I spotted was if I reformat any string style dates I bring back from SQL it takes an hour off them if I say they are date types - strange.
In that case the timestamps are wrong in the database.
That’s the thing there are no timestamp columns in the database - it’s massive and started long before anyone dreamed of Grafana, Like so many regional SQL databases the DateTime is stored as local time and no one is changing it for this tiny 12 dashboard project.
I got around the issue by simply using “now to now+1h” so all good again.
Grafana has probably been designed for small monitoring databases set up for that purpose instead of integrating an existing database which is fair enough.
It would be a nice to have the ability to work the time graphs off the std datetime(2) columns as it would expand Grafana usefulness but nothing I couldn’t get around eventually.
Thanks for all the help.
If the database is storing local time, why is it 2 hours out when you tell grafana to use UTC?
Exactly how are the timestamps stored? As strings? If so in what format?
The database table used stores the dates in SQL 2016 datetime2(7) format https://docs.microsoft.com/en-us/sql/t-sql/data-types/datetime2-transact-sql?view=sql-server-ver15
We have several systems hooked into the database but Grafana is the only one not behaving correctly. We have hooks on other third party tools, .Net codebases and if I even hook in via Excel on one of other HA copies dates are processed correctly - it is ONLY Grafana that can’t handle this.