Hi everyone,
I’m using Grafana(ver: 12.0.1) with Tempo(ver: latest) (running in Docker) and encountering an issue where trace visualizations are capped at exactly 2,560 spans, even though:
My trace contains well over 12,000 spans
I’ve set
max_spans_per_span_set: 0
in my tempo.yaml under query_frontend → search
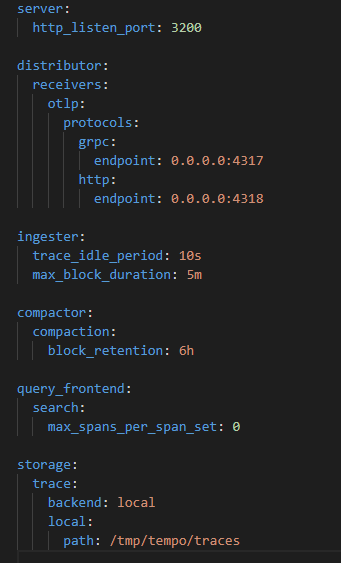
Here is my tempo.yaml:
I’ve restarted the container and confirmed the config is loaded
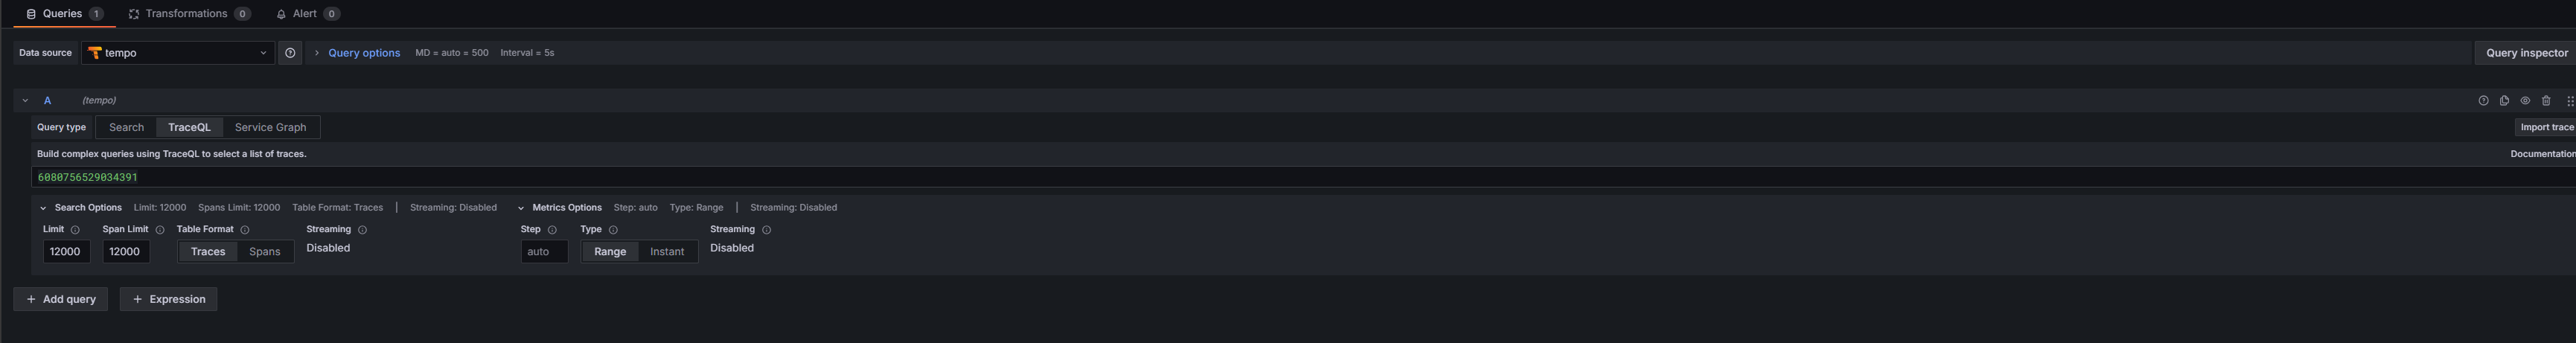
In Grafana Explore (TraceQL mode), I’ve set:
Limit: 12000
Span Limit: 12000
Here is the figure:
Despite all this, Grafana still only renders 2,560 spans.
Has anyone else run into this? Is there another setting in Grafana or Tempo that could be enforcing this cap? Is there any way to overcome the
Thanks in advance!
After days of debugging and thinking the issue was with Grafana UI or Tempo, I finally found the real bottleneck: OpenTelemetry’s OTLP exporter and BatchSpanProcessor default limits.
If you’re using a Python script to generate and export spans via OTLP (like I was), here’s what you need to know:
By default, the OpenTelemetry Python SDK uses a BatchSpanProcessor with these limits:
max_queue_size = 2048
max_export_batch_size = 512
This means that if you generate more than 2048 spans quickly, spans will be silently dropped.
Even if Tempo and Grafana can handle 10,000+ spans, you’ll only see 2560 or fewer, because the rest never made it out of your script.
Update your BatchSpanProcessor like this:
from opentelemetry.sdk.trace.export import BatchSpanProcessor
span_processor = BatchSpanProcessor(
otlp_exporter,
max_queue_size=100000,
schedule_delay_millis=1000,
max_export_batch_size=10000
)
1 Like