Hi,
I have already creates several time series panels, but this one drives me crazy… I have a time series where a new value is set only once a week or even fewer times. I would expect that if I set the proper time range, the values are connected and I can see a proper chart like it is the case for all my other diagrams.
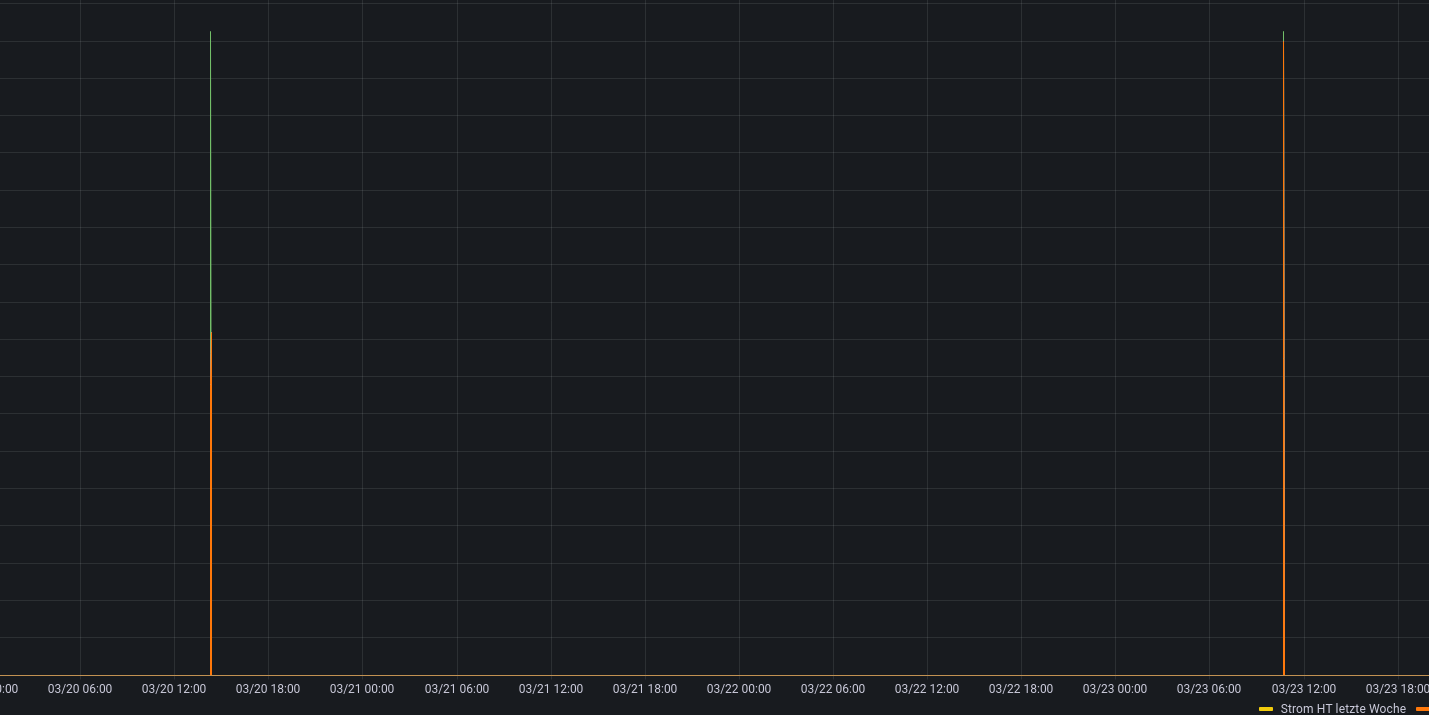
But it looks like Grafana creates “virtual zero values” or similar, so that I see peaks in the diagram for each value, but immediately the line goes back to zero again, which looks like this:
Looking at the InfluxDB data everything looks fine:
select * from vStromHT
name: vStromHT
time item value
1611413708578000000 vStromHT 15146.9
1611476952381000000 vStromHT 15364.2
1612124866082000000 vStromHT 15427.2
1612687394324000000 vStromHT 15472.5
1613294411450000000 vStromHT 15539.4
1613294422426000000 vStromHT 15539.4
1613895708198000000 vStromHT 15584.2
1614499816701000000 vStromHT 15612
1615150746831000000 vStromHT 15649.3
1615711846043000000 vStromHT 15688.7
1616317956043000000 vStromHT 15745.1
1616917492133000000 vStromHT 15778.5
1617558065593000000 vStromHT 15787.6
1618124399293000000 vStromHT 15821.9
1618744373396000000 vStromHT 15867.5
1619333797120000000 vStromHT 15893.5
1619333800933000000 vStromHT 15893.5
1619333818850000000 vStromHT 15893.5
1619939005077000000 vStromHT 15893.5
1619939008061000000 vStromHT 15893.5
1619939017142000000 vStromHT 15893.5
1619939137168000000 vStromHT 15905.4
1620543056447000000 vStromHT 15932.9
1621165900209000000 vStromHT 15933.9
1621885373509000000 vStromHT 15936.5
1623081242986000000 vStromHT 15948
1623569950968000000 vStromHT 15948
1623570056160000000 vStromHT 333
1623570128363000000 vStromHT 15950.2
1624209622781000000 vStromHT 15951.2
1624817781556000000 vStromHT 15952.6
1626634192431000000 vStromHT 15958
1627239044686000000 vStromHT 15960
1628437373020000000 vStromHT 15962.5
1647782390164000000 vStromHT 17249.3
1648028546769000000 vStromHT 17250.3
1648028615730000000 vStromHT 17251.3
it might be a simple thing, but I couldn’t get it working so far. I tried all possible options in “Graph Style” section, but without success.
Can anybody give me an hint what could go wrong here?
Thanks,
Martin