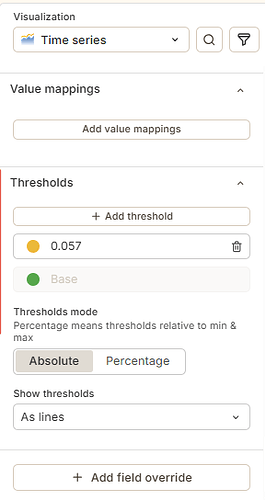
Hello, I am currently using Windows and Grafana 11. I am trying to establish a threshold line in Grafana. For some reason, when I want to establish threshold there will always be 2 lines showing, when I just input 1 line to establish a threshold below in this case 0.057, any help?
Hi @fayomayo,
Could you please confirm which data source is being used for this? Additionally, kindly provide some sample data that could help in resolving the issue.
Thank
Hello I am currently using InfluxDB
Hi @fayomayo,
As I investigated the issue, I’ve implemented a working solution. You can follow the steps below to replicate it.
Step 1. Create a bucket and Insert dummy data
Begin by creating a bucket in InfluxDB and populating it with sample data for testing.
Step 2. Integrate InfluxDB with grafana
Step 3. Configure the Panel Query
from(bucket: "thdata")
  |> range(start: -0)
  |> filter(fn: (r) => r._measurement == "response_time")
  |> filter(fn: (r) => r._field == "value")
Step 4. Set thresholds
Final output :-
Thank you for the help! I figured other than your suggested solution, using SPC control chart (new feature, I think) would display threshold line accurately as well ![]()


