I thought I had the templating working, but I’m not seeing any differences in the roles I have configured. When I pick different “Roles”, I get the same values in the graphs and they should be different.
Please let know what I’m doing wrong.
I thought I had the templating working, but I’m not seeing any differences in the roles I have configured. When I pick different “Roles”, I get the same values in the graphs and they should be different.
Please let know what I’m doing wrong.
Thank you for the reply, is there a way I can do it for all servers within a role?
I want to be able to pick a role from our enviorment and it will grab all servers stats within that role. I see data in the graph as is, but I do not think its getting data from the correct hosts (servers) within that role.
I have the Role template working, its just getting the hosts within that role into the graphs.
Please let me know
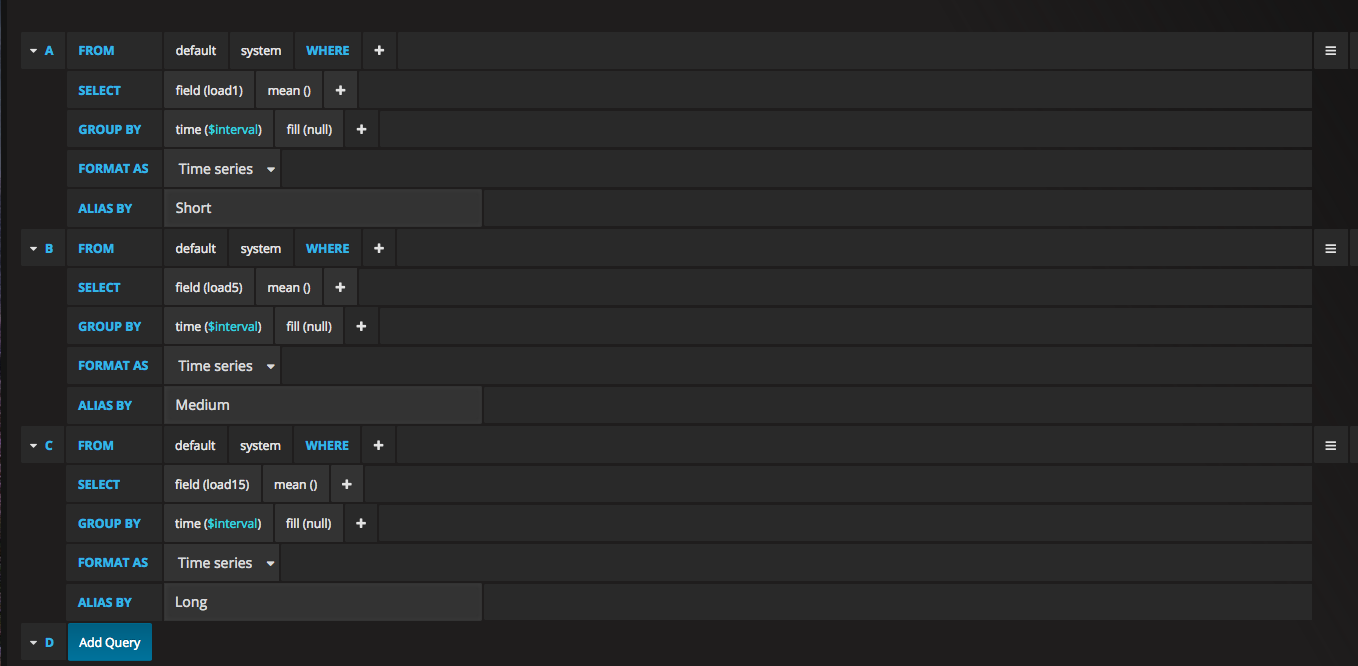
Something like this you are referring (I used for the host =~ “/.*/” to match all Servers and I didn’t used a template).
Could you be more specific please?
Kind Regards,