Next I Shared the dashboard as a ‘Snapshot’. When I view the snapshot
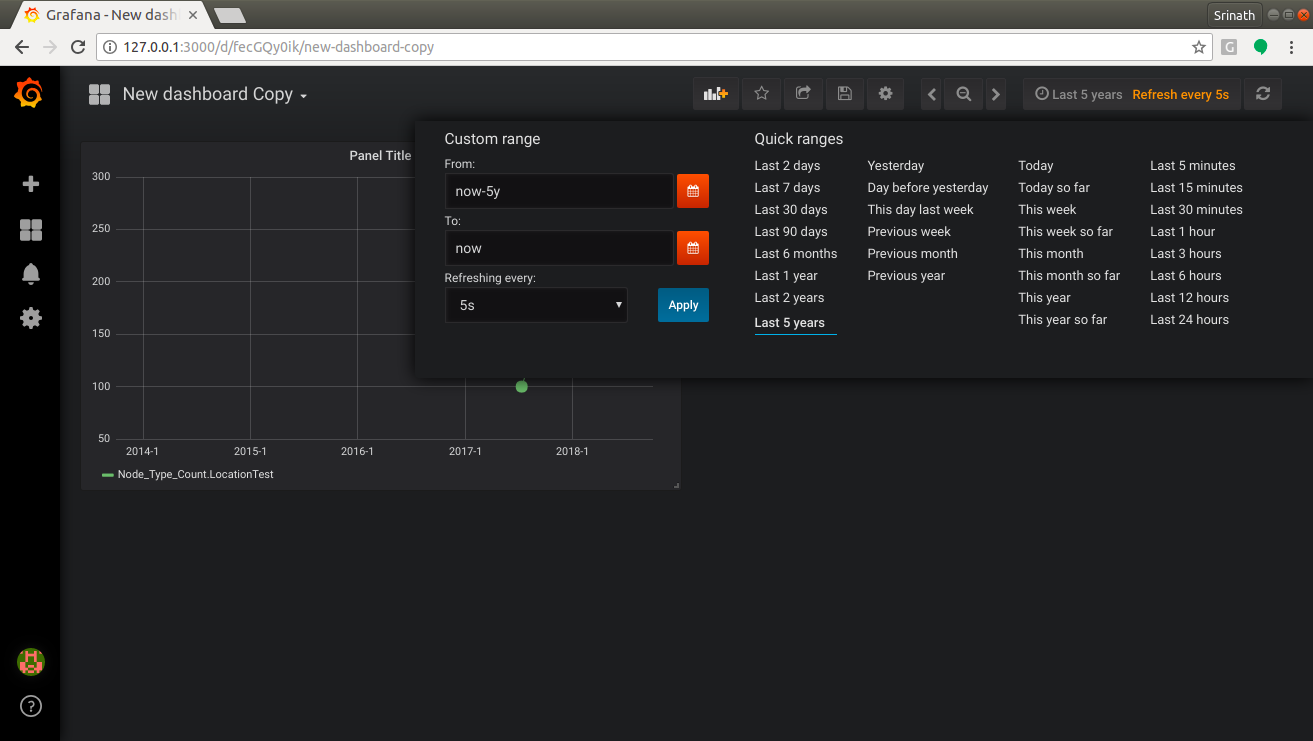
Refresh rate is not saved
Snapshot graph does not update the graph for the database changes
When I manually set the refresh rate in the snapshot dashboard, it does not accept the change and chrome inspect element prints the following “Form submission canceled because the form is not connected”
A Grafana snapshot is a snapshot of your data and dashboard settings at a specific point in time. Refresh rate is a setting on a dashboard that is using a datasource but since a snapshot has all the data baked in there is no way to actually refresh it (unless you publish a new snapshot). In other words, setting a refresh rate wouldn’t make sense.