Hello,
i am struggling to make a correct bar chart. I want to display the producet energy by ma solar system. It works so far but shows the wrong date on bottom of the bars.
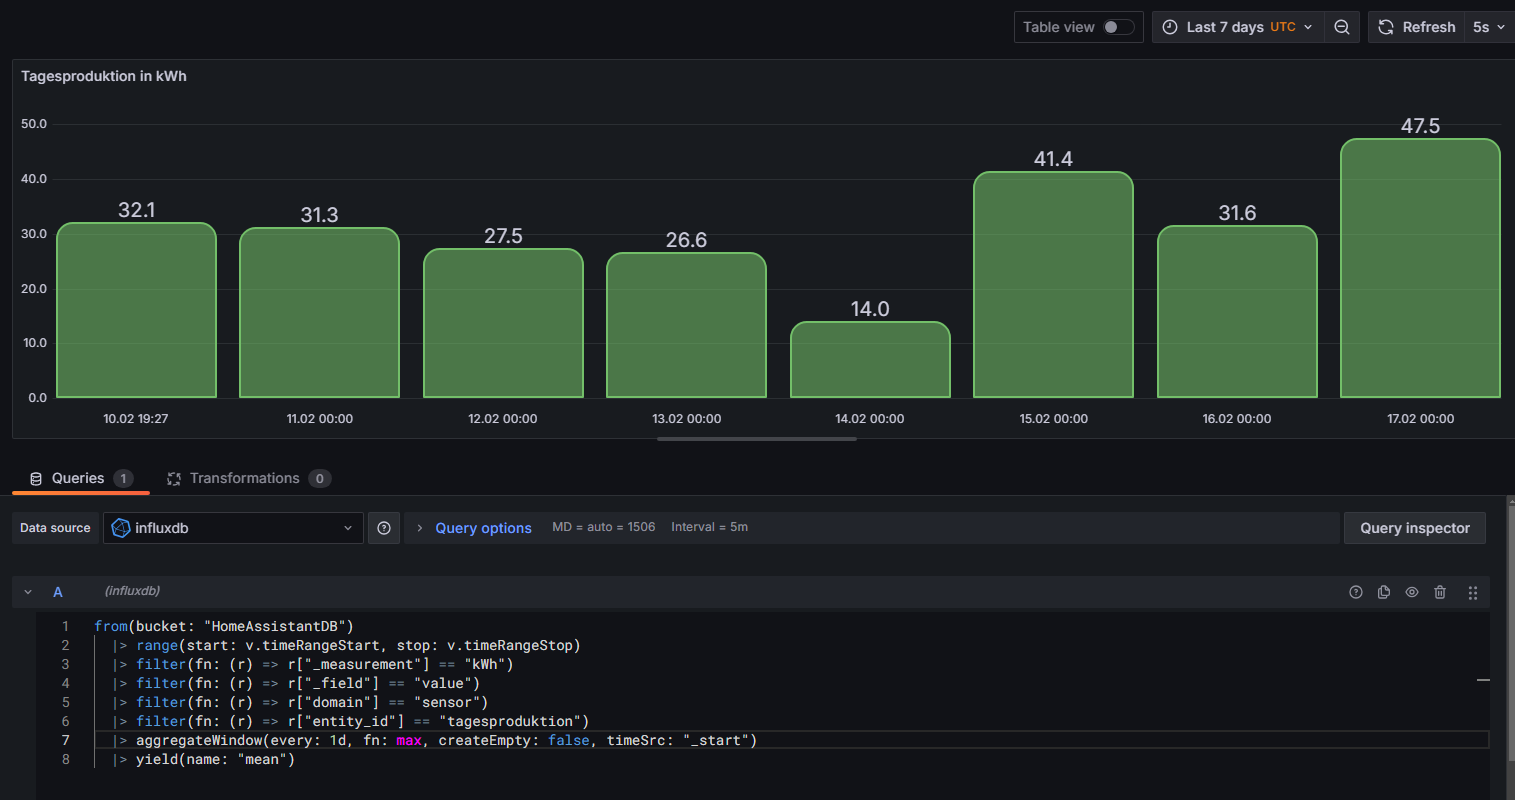
The values are correct.
The last bar is correct. All the others are 1 day ahead (10.02 should be 09.02 and so on). 16.02. is there twice, the first should be 15.02 the second is correct.
Can aynone please help me.
regards johannes
Try changing
|> aggregateWindow(every: 1d, fn: max, createEmpty: false)
to
|> aggregateWindow(every: 1d, fn: max, createEmpty: false, timeSrc: "_start")
Description of timeSrc parameter
1 Like
Thank you for the tip.
It helped at the end of the date but brought another problem. When i select the “Last 7 days” it does not take the first day full, but starts from now 7 days back and so it does not show the full data for the first day. In the picture it should be 34.8 for the first day (not 32.1).
If i change the time range on top from “now-7d to now” TO “now-7d/d to now” it works, but gets wrong every time I change the range via quick range. Is there also a way to save the additional /d for the time range?
Try something like this:
import "date"
from (bucket: "HomeAssistantDB")
|> range(start: date.truncate(t: v.timeRangeStart, unit: 1d), stop: v.timeRangeStop)
...
Works perfectly for me.
Thank you very much!