I’m using Grafana to visualize CPU, memory, and disk metrics from Prometheus using Node Exporter as the data source. However, I noticed that my Grafana dashboard only displays historical data for the past 15 days, even though I’ve already configured the data retention period to 90 days in Prometheus.
Could you please help me understand what might be causing this issue?
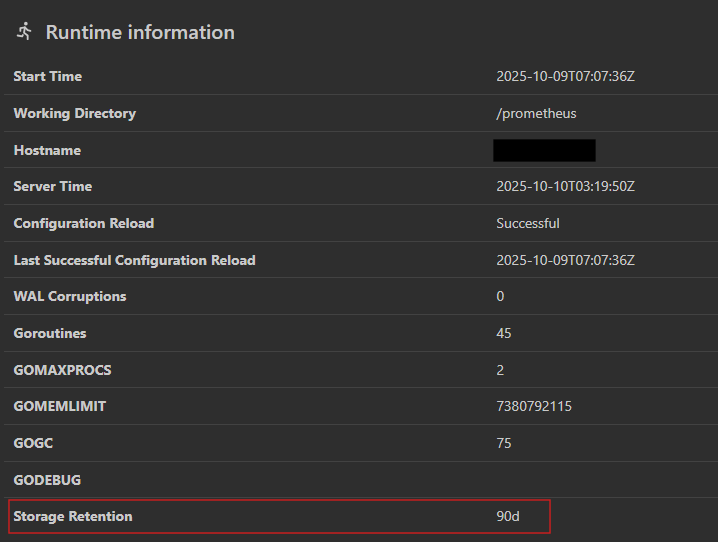
Is there a way to verify or troubleshoot whether the data retention settings are actually applied, or if old data is being deleted due to storage limits or other configurations?
Which version of Grafana are you using (Cloud or OSS)? If Cloud, are you on a paid tier? The free tier’s storage of Metrics is limited to 14 days, regardless of what your Prometheus settings are.
Hi @feetee00500 Grafana (Cloud or OSS) does not store any data. You connect it to a datasource of your choice. That datasource can hold 5 minutes or 5 decades of data depending on how you configure it.
It sounds like your Prometheus datasource is also on-prem. By default, Prometheus stores data for 15 days and you can change this by changing the retention period, which is controlled by a command-line flag you set when starting Prometheus.
You can control data retention in Prometheus using two primary flags:
Time-Based Retention: Use the --storage.tsdb.retention.time flag to set how long to keep data. You can use units like d for days, w for weeks, and y for years.
Size-Based Retention: Use the --storage.tsdb.retention.size flag to set a maximum size for the storage blocks (e.g., 50GB).
If you set both flags, Prometheus will delete data whenever the first limit is reached.