I’m using SimpleJson datasource to request data from a server using time series request. When graphing the data, the date and time resolution changes with the time range. If it’s small, I can see the seconds. If it’s big, I can’t. If two rounded datetimes are equal, the data is aggregated. I would like to disable this feature and have the original datetime on my chart, but I couldn’t find any settings for that.
Small range → I can see the seconds
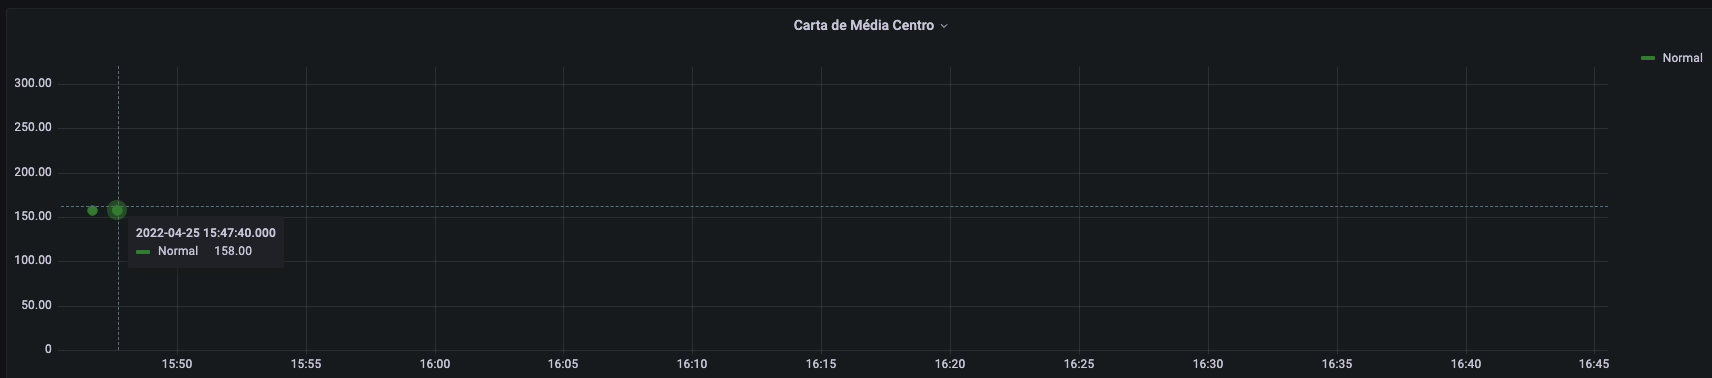
Large range → I cant see the seconds

- Grafana version: 8.5
- Data source type & version: SimpleJson 1.4.2
- OS Grafana is installed on: Ubuntu
- User OS & Browser: Mac/Chrome