I have a question regarding Loki label relations. Seems I found a bug.
Grafana: 10.2.6 Loki:3.0.0
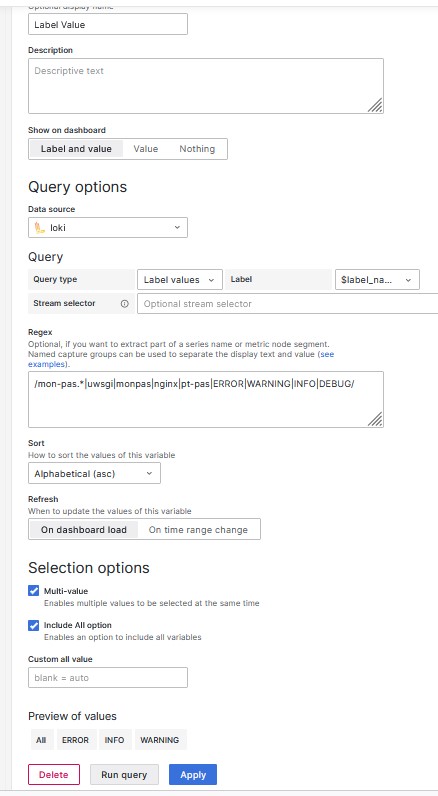
I created label_name, label_value and loglevel variables.
label_value returns loglevel labels (INFO,WARNING and ERROR)
In the 3rd variable (loglevel) with tream selector {$label_name=~“$label_value”} → in the preview I don’t see level “ERROR”.
In the my dashboard, Label name: loglevel, Label Value: ERROR is exist
level show: INFO and WARNING but should ERROR as well.


Can you try to use an API call to list the labels and see if that reflect the same results? I unfortunately haven’t upgraded to 3.0, but if you can easily reproduce it might be a good idea to open a bug in github with repro steps.
Can you come up with a scenario that can be used to reproduce your error? I just deployed a test Loki 3 cluster, and I am unable to reproduce this. What I’d like from you:
- Give some example log lines that can be used for injection.
- Example queries that can demonstrate the problem.
So I can follow the same steps and see if this is indeed an issue.
Hi,
I uploaded a dashboard for grafana.
For reproduce issue, please add severity DEBUG for example in log file.
You will see it in the label_value but not in the level variable if Stream selector is not empty.
There is no errors in the loki logs.
It’s issue appear random and for every new cases.
Loki – PT-PAS Copy-1716810673039.json (25.5 KB)

I noticed if remove value for Stream selector - level is appear.
Seems the relation between host and loglevel is broke
updated grafana to 10.4.3 version
Are you able to provide some example logs I can test with?
Anyway, here is what I’ve done to try and replicate this. Please let me know if there are parts where I am not doing what you are doing.
I generated the following test logs, essentially label tonytest has info, error, and warning logs, 2 count of each, while tonytest1 label only has info and warning, 2 count of each.
{"app": "tonytest1", "level": "info"} this is info log
{"app": "tonytest1", "level": "info"} this is info log
{"app": "tonytest1", "level": "warn"} this is warning log
{"app": "tonytest1", "level": "warn"} this is warning log
{"app": "tonytest", "level": "warn"} this is warning log
{"app": "tonytest", "level": "warn"} this is warning log
{"app": "tonytest", "level": "error"} this is error log
{"app": "tonytest", "level": "error"} this is error log
{"app": "tonytest", "level": "info"} this is info log
{"app": "tonytest", "level": "info"} this is info log
What this looks like from explorer:
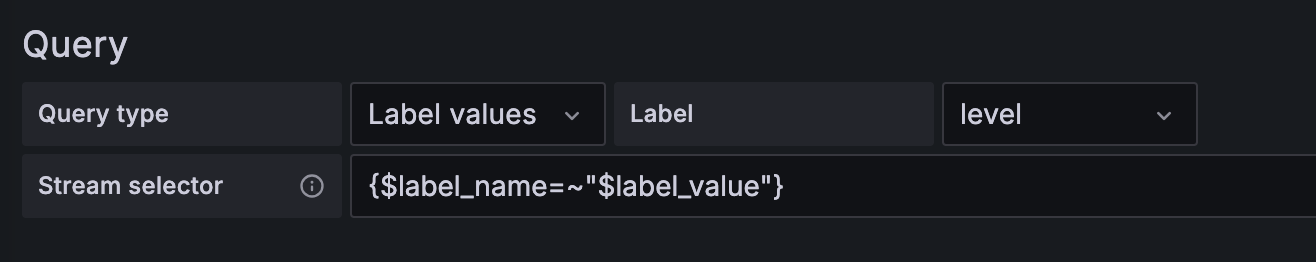
In dashboard, I configure three variables. label_name and label_value are hardcoded, log_level is configured as {$label_name=~"$label_value"}:
And as you can see from the dashboard, the dropdown menu does reflect on the change of what label_value is selected as, and i don’t see anything missing:
Please check level ( log_level) in 12h…
I have 9.03 Mil records per day and might it somehow to related to my relations
We haven’t upgraded our production cluster to Loki 3 yet, I’ll have to test with our production logs later.
Do you notice this issue if you try to list labels with an API call?
No API always returns correct information.
If API always returns correct information then it’s most likely not Loki.
Is your variable configured to refresh on dashboard load, or always refresh? I am wondering if it might have something to do with the time frame of your dashboard and the distribution of the logs with different labels.
All variable configured to refresh on dashboard load
I noticed that this issue occur occasionally
Can you try changing the variable to load on time range change? Other than that I am not sure what else to try, since I am unable to reproduce it.
Tried - no changes.
I found workarounds - after changing two times - Label name - problem is gone

or
from Dashboard settings → Variables run “Run query”