Hello. I try to monitor network traffic from device D-link DGS-3420-28TC.
Looks good, but I want an opportunity to check devices interfaces manualy from the table,so I use variables.
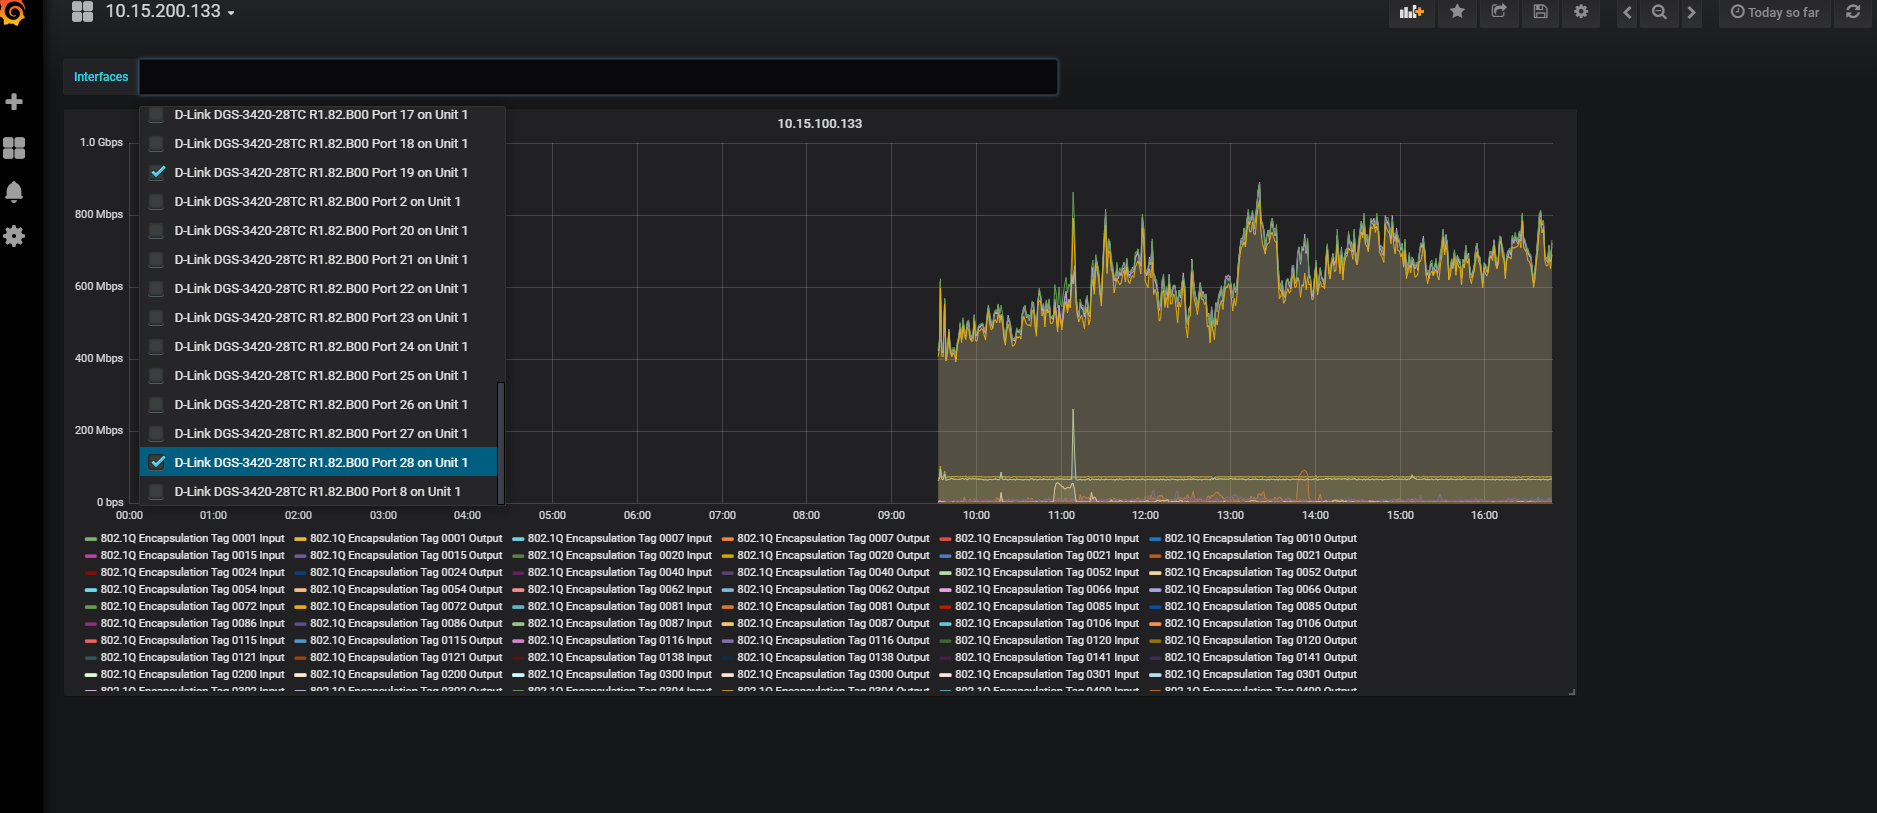
I make it, but it didnt make changes, when I check one or two interfaces:
Config of variable:

And my InfluxDB query looks like that:
SELECT derivative(mean("ifHCInOctets"), 1s) *8 AS "Input", derivative(mean("ifHCOutOctets"), 1s) *8 AS "Output" FROM "autogen"."interface" WHERE $timeFilter GROUP BY time($__interval), "ifDescr" fill(null)