Hello,
I’m using this SNMP dashboard to gather server health via their iDrac cards.
For most part it’s working, but I’m getting gaps in the data. I’m only just started using Grafana so I’m not sure how to debug. I’m using it on Ubuntu 20.04 LTS (6 vVCPUs, 16GB mem, 100GB).

But at times get this.
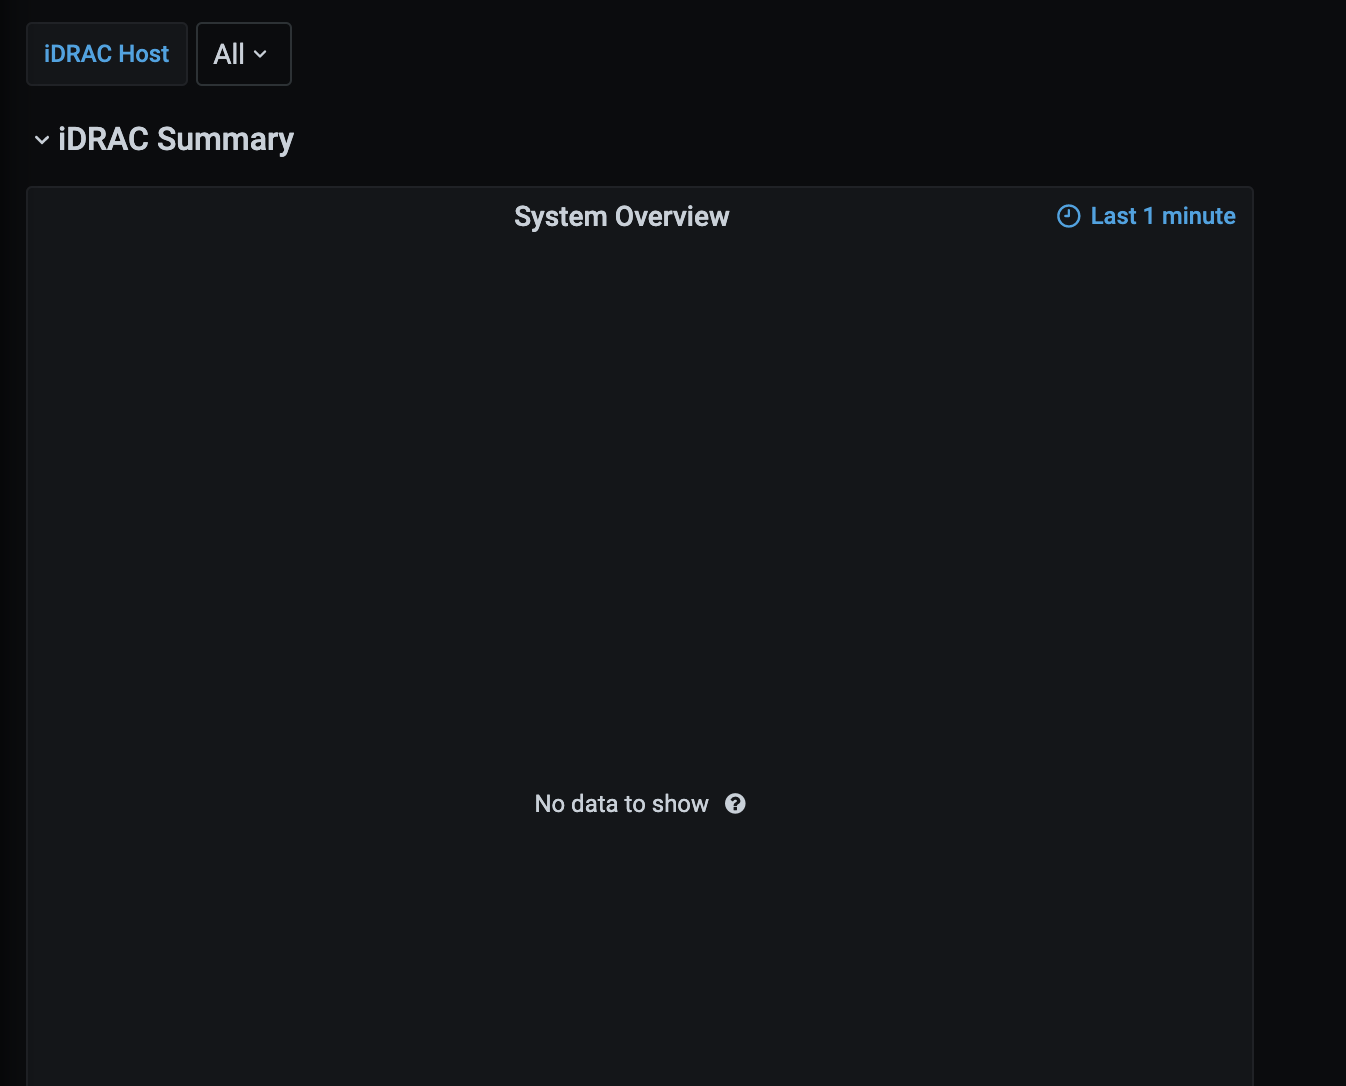
I’m guessing while it goes off to query it disappears.
Could it be that 1 of the IP’s that I’m querying via SNMP is taking too long and holding everything up?
Can I do something with the query so it’s not so aggressive or keeps the info on the screen while it queries?
Thanks