I want to use one channel for all alerts in my Grafana Cloud: AlertManager for both the Synthetic Monitoring and the Panel alerts. The Grafana documentation (Alert notifications | Grafana Labs) refers to the Prometheus documentation (Alertmanager | Prometheus), but I fail to get it to work.
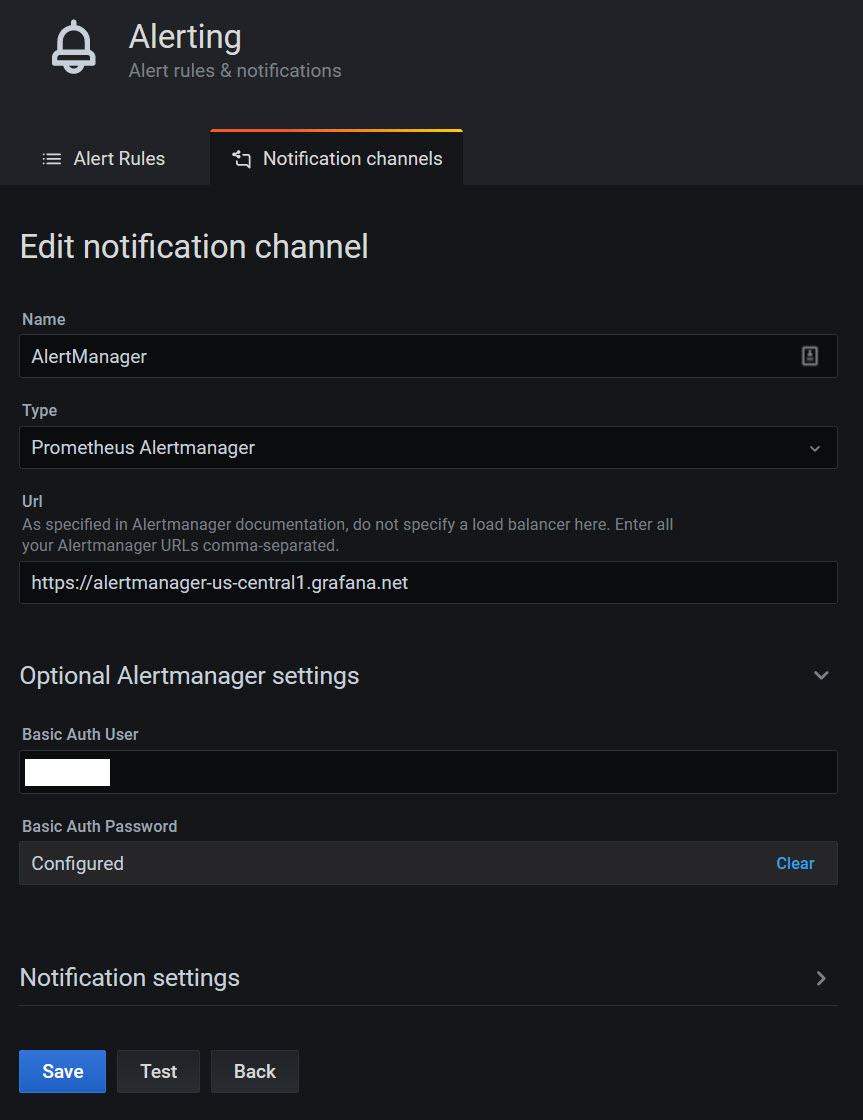
In the AlertManager notification channel I have provided the information from the Alertmanager Authentication Settings from the Alerts section of the Grafana Cloud Portal, but that doesn’t work.
Have you visited the cloud alerting section of your Grafana instance? You can configure the alertmanager from there. If you enter your email address in the provided input, it will generate a default configuration for you with a default route and email notification channel. That config can be used for routing alerts from synthetic monitoring (or any prometheus style alerts). Panel alert notifications can’t be configured from your cloud alerting alertmanager at this time.
Thanks, we have configured the alertmanager and it works great when using the synthetic monitoring. So the configuration of the alertmanager itself isn’t the issue.
Why is there an alertmanager notification channel for panel alerts? Is that only available for self-hosted Grafana instances?
URL = URL
Basic Auth User = User
Basic Auth Password = API key
My alertmanager config works, we get Slack, email and webhook messages from Synthetic Monitoring. But if I test the notification channel, I don’t get anything.
@support4a07 the second screencap you shared in your latest reply is showing the general “Alerting” page in your Grafana which is specific to panel-based alerting notifications, not query-based Alertmanager alerting. For Alertmanager configurations and those notification channels you’ll want to click on “Grafana Cloud Alerting” icon further down on the left menu which looks like a little cloud with an exclamation mark in it (not the bell icon). See @rdubrock’s screencap from his initial response for reference.