We installed it on our server for monitoring 5 active servers. As data collectors we use Telegraf, but we had problrms with Grafana Alerts.
Have you a case iabout how to send identical alerts on identical dashboards (in development mode) for 5 different servers (Datasources).
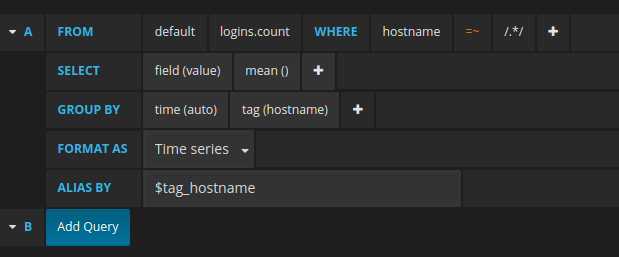
I understand that you can’t use template variables in notification requests, so we need to create 5 identical dashboards with a hardcore (datasource) to send 5 identical alerts, for example, to notify me about the overflow of space on your hard drive?
Thanks a lot for answer or href in documentation, or special tags or querrys in Google witch will discaver this theme for me )
Thanks, for your answer. I thinks the solution can be to assign template variables in alert or create some constants or may be some manual is already exist on this theme.
This is not exactly solution.
There is several $datasources are used. And its combined in the dashboard
with different template variables. The dashboard has often updates, and I
can not use a “hardcode” instead $datasource value
I’m interested about this topic from long time ago.
I’ve tried many approaches with no success.
Hi,
Sorry to open this topic.
I’ve tried to implement the alert in Grafana Dashboard but not working when you have a Dashboard with templating.
I’ve noticed that are some opened topics on GitHub regarding this subject: #6230, #6557.
–=Solution=–
The solution will be to have a Dashboard per Server in order to have alerting working?
vs
Other solution will be to have Dashboard per Services in order to have the alerting working.
vs
etc…
I understood that is not possible to have Alert in Grafana per each server present in the same Dashboard.
No resolution on internet regarding this, the only thing remains to have per service per server a Dashboard in order to have Alert available.
Hi All, anyone got solution or is there any update on this? we got a situation where we need to create incident in incident management tools like Servicenow if there is any alert from Grafana, with the help of servicenow email inbound action I was able to configure and create incident but is there a way I can use message templates in Grafana? so that I can use the data present in the alert effectively in the servicenow with less script. or do we have any way to customize the grafana alerts? also we do have 300+ CI items for all the environments it would be difficult to maintain too many dashboard. any help?
@torkel Thank you for example about wildcard query. I was wondering if you could give a similar example for prometheus as the example you provided seems to be for mysql or influxDB.
I am very new prometheus and PromQL I was not able to create wildcard query to get node_memory_MemTotal_bytes from prometheus for all my servers.
I would imagine something on the lines of node_memory_MemTotal_bytes{instance=~node_exporter_build_info{job=~"node"}} , here I would to like replace node_exporter_build_info{job=~"node"} with appropriate wild card query so that I can create an alert for all the servers.