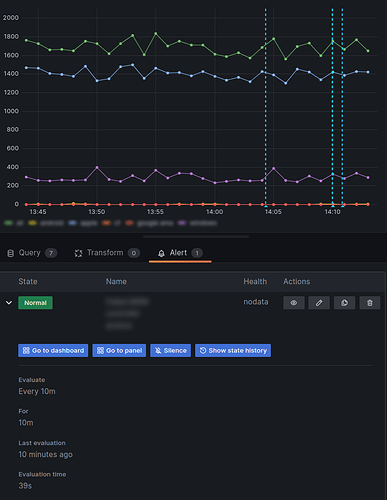
Grafana Alerting shows 'Firing' in preview but shows 'Normal' in the panel

I have configured an alert on the ‘Edit Alert’ page, and when I click ‘Preview’ for the alerting condition, I see a red pill which reads ‘Firing’. That’s what I expect because I’ve set the threshold to just 1, and I am seeing counts of more than 1000 in my panel.

However, the alert isn’t firing. When I look in the ‘Alert’ tab for the panel from which the alert gets its data, the status appears as a green pill that reads ‘Normal’.

I’ve been reading and tweaking, but to no avail. What could my next troubleshooting steps be?
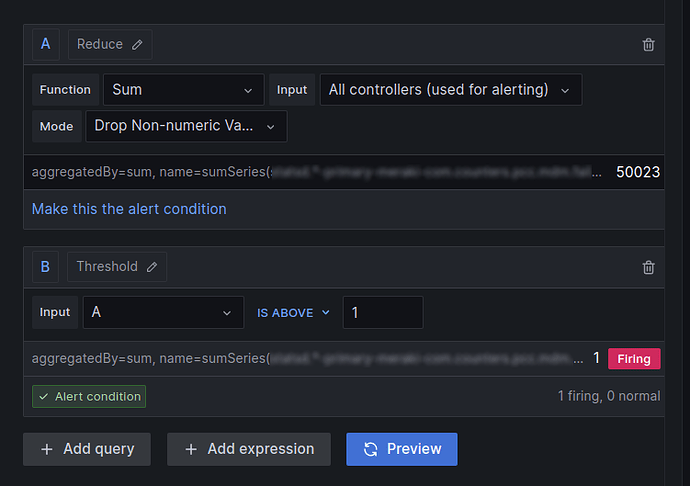
Hi! It looks like the query in your alert rule is returning No Data at least some of the time (I can see this in the Health column). I would start by adjusting the query to make sure it’s always returning data and then we can take another look?

Thanks. I didn’t think it would make a difference that I had some queries that returned nodata in my ‘Edit alert’ page because they weren’t part of the pipeline for the alert condition, but after removing them, the alert is firing!