- What Grafana version and what operating system are you using?
8.4.4 self hosted on ubuntu behing nginx
- What are you trying to achieve?
Create an alert
- How are you trying to achieve it?
using new alerting platform
- What happened?
Alert don’t fire and don’t show values variables. (labels seems to be ok)

- What did you expect to happen?
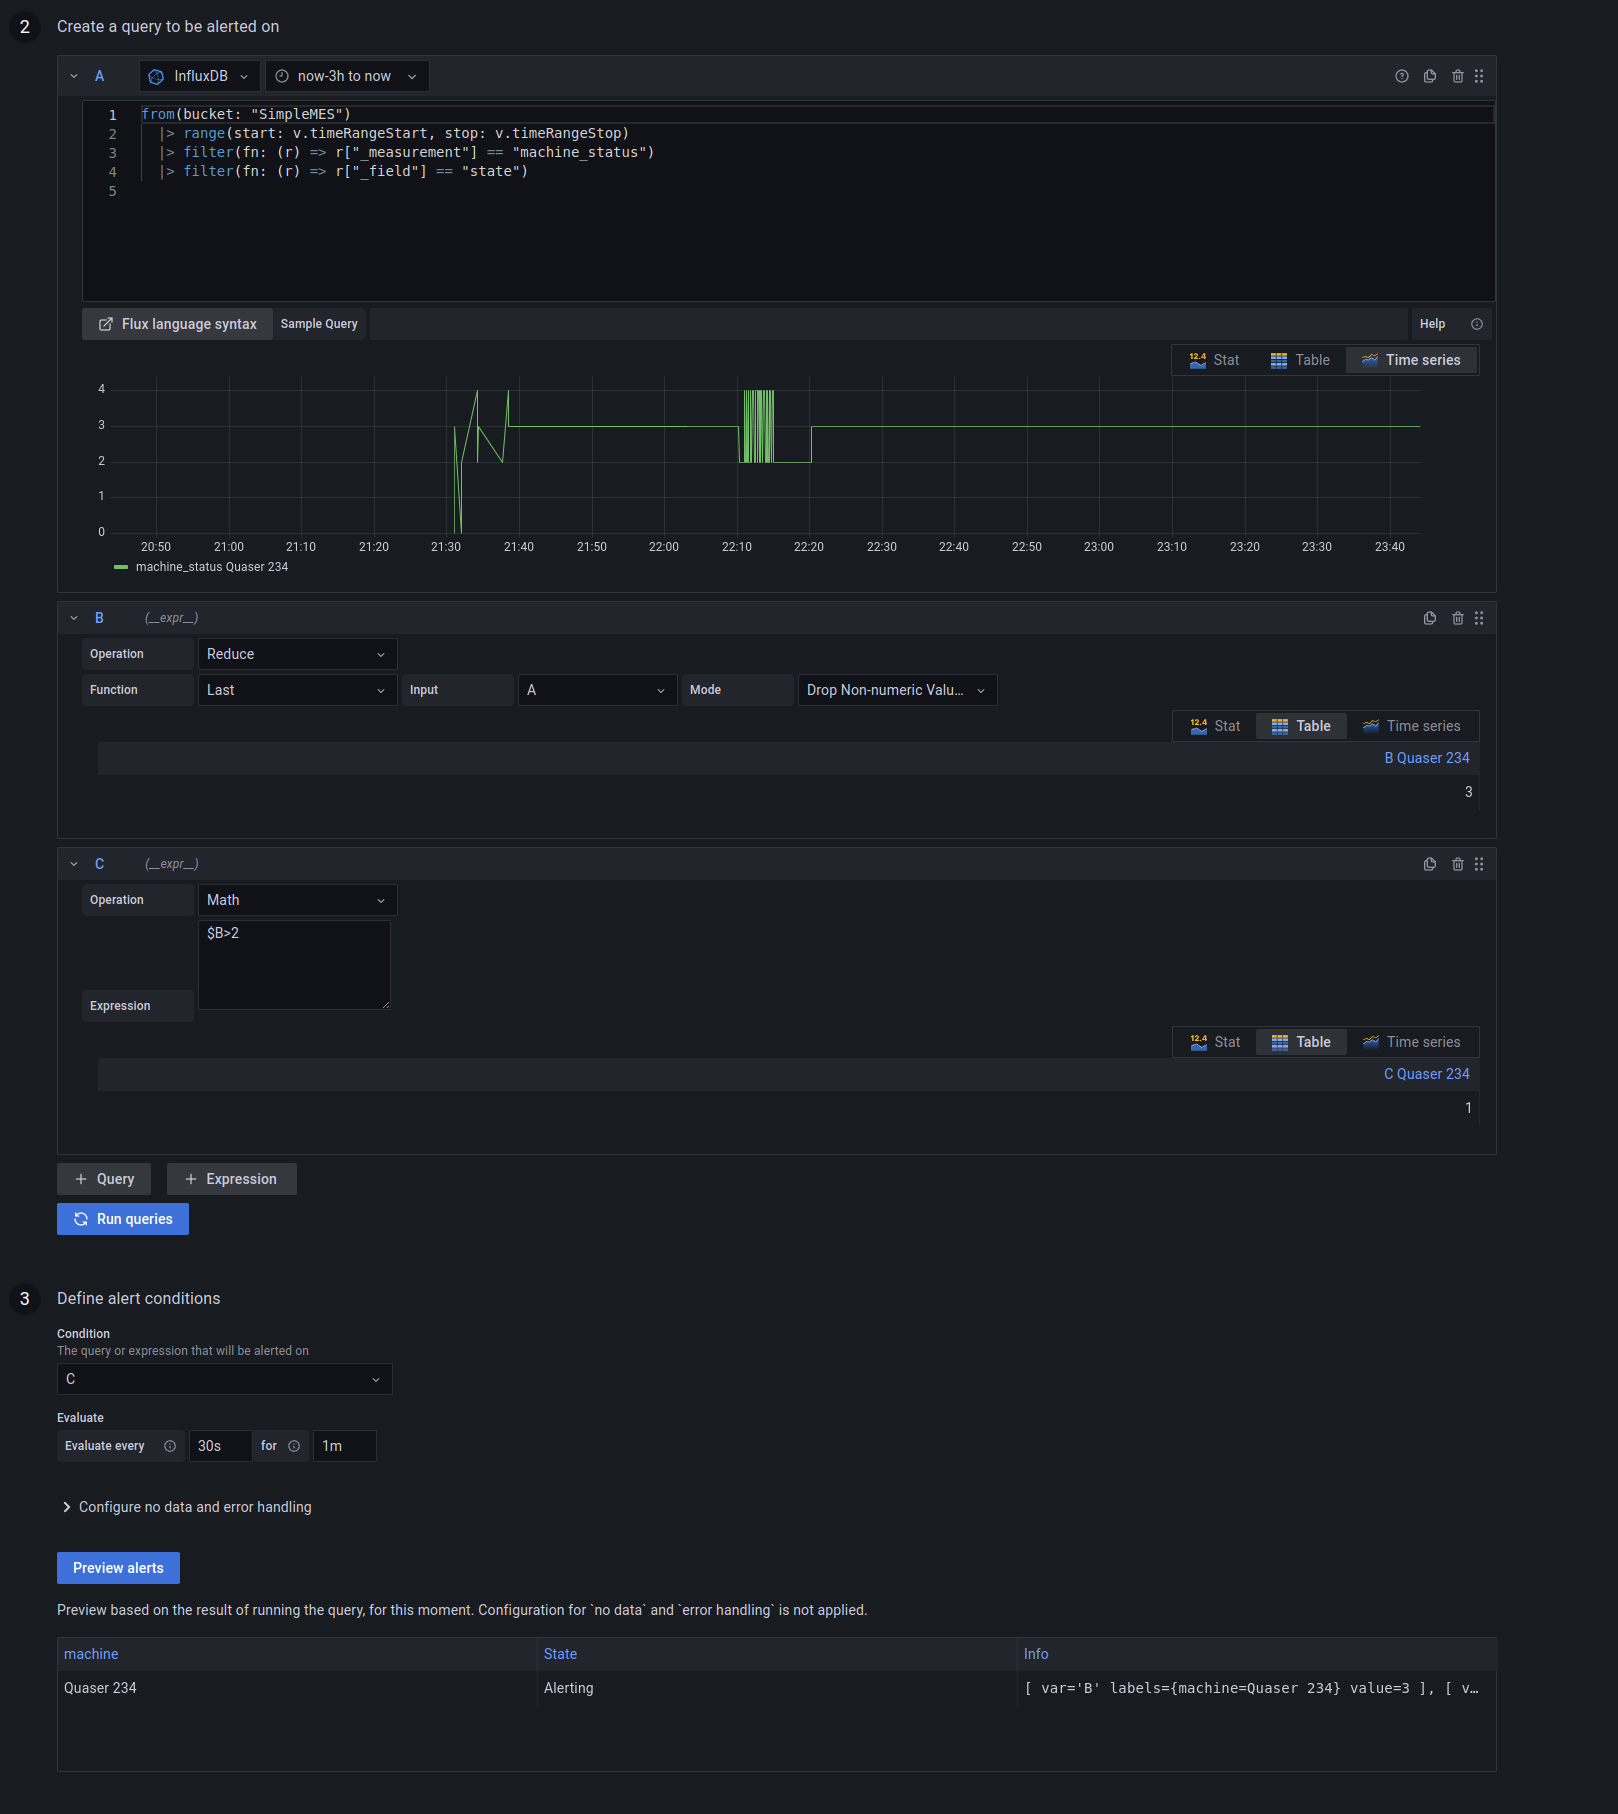
Why do I see the good information in the “creating rule” UI :
You can see
- the query with reduce + math condition
- the alert preview which is alerting with informations.
- Did you receive any errors in the Grafana UI or in related logs? If so, please tell us exactly what they were.
No error in console.
I’m using grafana+influxdb behing nginx reverse proxy, is it a indication ?
- Did you follow any online instructions? If so, what is the URL?