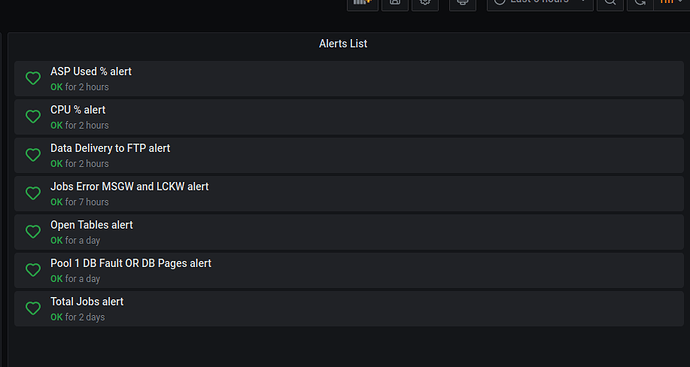
The second screenshot in after refreshing on the dashboard screen. Still grey heart
I suggest you create the new dashboard with Panel of List Of Alerts, there’s already provided, and you can see the state of the alerts that you have.
I went to the alert rules page from the sidebar. You can see it isn’t reading the AB alert properly. I feel liek there must be a feature/option messed up somewhere. I’m going to look at the config file because it’s just so strange. It has all of the alert states for everything months ago, where we restored from to make this test instance to upgrade on, but nothing has changed since.
I see my Dashboard NOT show a heart when I have the time range include a “now-10m”.
I was able to rectify this issue by adjusting the alert parameters on the config file. I can’t recall the exact line off the top of my head but there is an option to enable alert emails/notifications and that was set to false and as soon as I enabled it, the hearts and alerting fixed themselves.

