Hi, currently using Grafana v9.2.5.
I’m trying to map some data as a percentage, and colour it based on its value from zero.
I would like to use gradient mapping, eg. the Green-Yellow-Red gradient mapping available in Grafana.
I have positive and negative values which I want to retain. The closer to zero deviation, the better, so I want green around 0, and yellow/red as the value deviates further from this.
Trying to use gradient mapping for this purpose doesn’t seem to work.
To clarify, I want the following idea:
-2% -1% 0% +1% +2%
mapped to:
red yellow green yellow red
With a smooth gradient between them. When I try to gradient map this, it maps the negative numbers to green (with more negative = greener), 0 to yellow, and positive to red.
I have tried using an absolute value helper column from SQL, so that grafana can use this for gradient mapping via the “color by field” setting.
It somewhat works, it now scales higher as it moves away from zero. But it maps between yellow and red only.
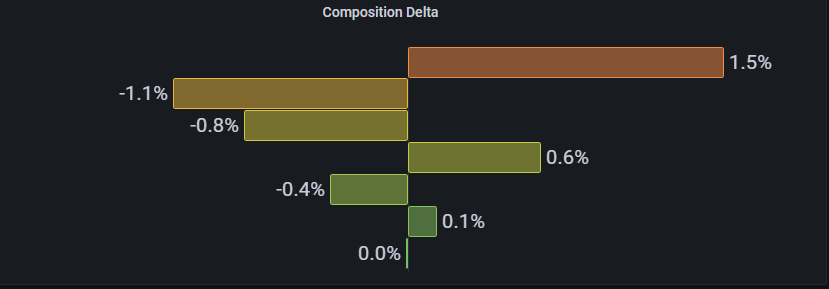
If I try graphing from -2 to +2, it looks like this:

This is because it’s mapping the absolute values of [0 to 2] on to a gradient scale of [-2 to +2], so the green is never mapped to anything.
If I set the range of graph between 0 and 2, the colour is mapped correctly according to the absolute values, but the negative values aren’t shown because of the graph range having a min of 0.
I guess the main issue is that:
- I want to graph from -x to +x
- I want to gradient map from 0 to x, mirrored in both directions
I can’t seem to do these independantly of each other.
I’ve found a somewhat hacky way of doing it, by using a symlog scale instead of linear, and setting the linar region to the entire data range:
This allows me to colour map from [0 to ±2] by setting the range of the graph to min 0, max 2 and using my ABS() SQL column, but for some reason in symlog scaling mode, Grafana will not truncate the axes and it will actually display the negative values.
Using this method I can’t get gridlines to work, and it seems very hacky since I’m not graphing any log values and it doesn’t seem like the correct way of solving this issue.
Is there any way to properly do this with linear scaling and the option for gridlines?
Thanks.