Hi There,
What is the default frequency at which Grafana queries a data source?
Is it queried based on dashboard refresh time only? Just wanted to confirm whether that is the only criteria or not.
Hi There,
What is the default frequency at which Grafana queries a data source?
Is it queried based on dashboard refresh time only? Just wanted to confirm whether that is the only criteria or not.
Acc. to this, queries run on their own schedule according to the panel settings. However, if you want to regularly refresh the dashboard, then click the down arrow next to the Refresh dashboard icon and then select a refresh interval.
In the query shown below, I believe we are selecting the mean of all the values within a 1-second interval. That would produce a single data point that would appear in Grafana. Might want to set up some simple test data to experiment around. And BTW, there was not a smaller interval than 1s in the Group By dropdown (at least for me).
Hi @grant2 ,
Thank you for sharing the link. The time range mentioned in the link, isn’t it referring to the amount of data we are to display on the panels?
From what i have understood so far, We can set the time range of the graph we wish to display (We want to display last 3 hours data). We can refresh the dashboard to update the data on all the panels based on the set time.
![]()
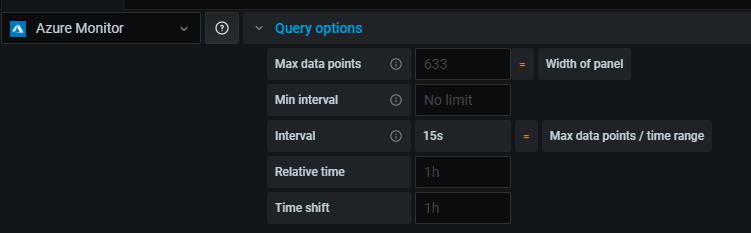
On panel level, we have Query Options as well: we can scale data to be displayed
The interval Option here also aggregates data based on the number of maximum data points set for the panel.
I am trying to monitor an Azure data Source, which also has a Time Grain field (similar to the Interval option in Query Options)
Not sure about the Time Shift & Relative time option in Query Options. Based on the link it seems to be the time range selection options for a panel to override dashboard setting. But Still on my dashboard it was showing last 3 hour data only.
What i wish to identify is
The number of times Grafana would query Azure Data Source to fetch data.
In case, we have set the Dashboard level time range to “Last 1 hour”.
The time grain in Azure query is set to 5m. The Interval in Query Options is set to 15 Sec. Dashboard refresh rate is off. So, would Azure only be queried Once for last 1 hour data with time grain of 5 minutes?
Lets say 5 minutes have passed, now if we refresh the dashboard it would again query Azure data source to fetch last 1 hour data (Which would include 55 mins of data fetched in earlier query)
Please do let me know in case I’ve missed out on anything.
@adhirajg
Hello I have the same question. Did you already figure out how Grafana trigger the query? Thank you!
@grant2
Hello ,do you know where I can find more explanation or examples for the following statement? Thank you!