hello everyone,
i have two grafana instances (one is 7.2 and the other is 11.2), and i need both of them, they use the same exporters but different prometheus and for the same targets which are a tomcat instances, and since a week ago, i get a lot of false positives (instance down) on the older version, on both prometheus i can see the changes of state from up to down to up(i repeat it is always false positive) but on the newer one i get no alerts. i report screenshots to show the difference:
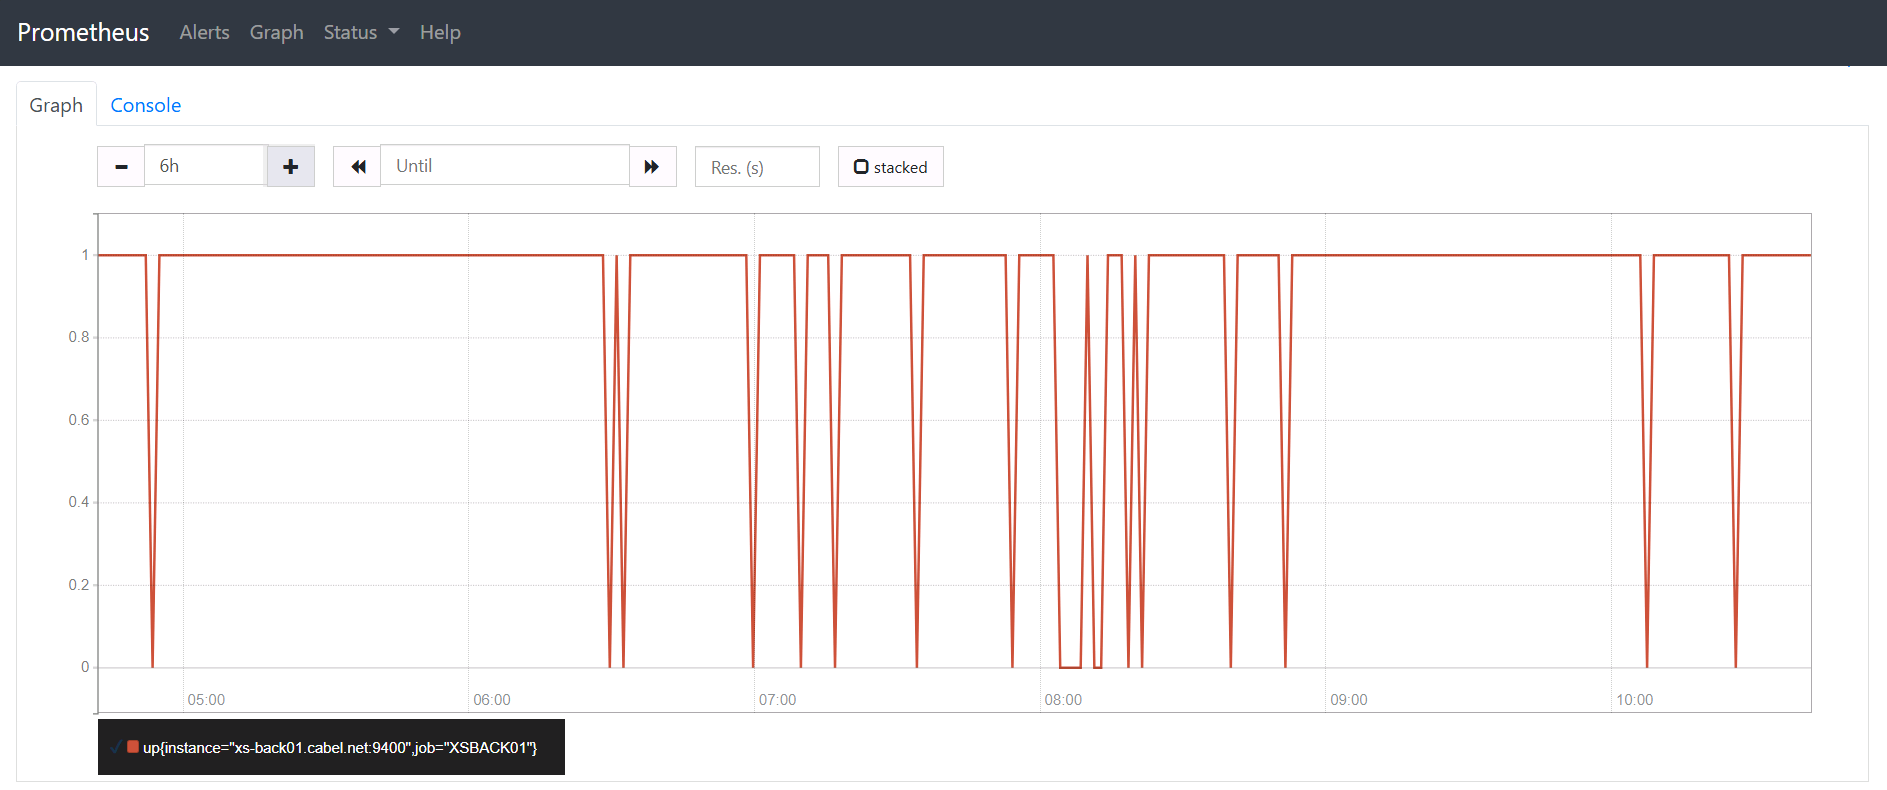


i add that both have the same pending period (3m)