-
What Grafana version and what operating system are you using?
Grafana Enterprise v11.0.0-68547 (15122bc71c) -
What are you trying to achieve?
I have a time series data, trying to apply a threshold expression to it.
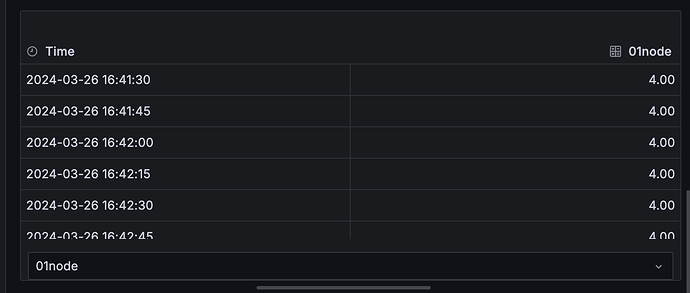
This is the data before applying threshold expression.
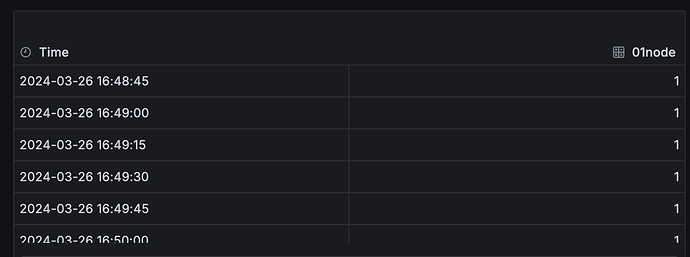
This should be the data after applying threshold ($A > 0)
I am able to do this on my local Docker Grafana (Grafana v10.4.1 (d3ce857c0e)) but not on the enterprise version. It just gives me no data when threshold expression is applied
-
How are you trying to achieve it?
By applying threshold expression to a timeseries data. Even by doing Math expression$A - 1doesn’t work -
What happened?
No data -
What did you expect to happen?
It should return a timeseries of booleans -
Can you copy/paste the configuration(s) that you are having problems with?
{
  "datasource": {
    "type": "prometheus",
    "uid": "grafanacloud-prom"
  },
  "fieldConfig": {
    "defaults": {
      "mappings": [],
      "thresholds": {
        "mode": "absolute",
        "steps": [
          {
            "color": "red",
            "value": null
          },
          {
            "color": "orange",
            "value": 70
          },
          {
            "color": "yellow",
            "value": 85
          },
          {
            "color": "green",
            "value": 95
          }
        ]
      },
      "color": {
        "mode": "thresholds"
      }
    },
    "overrides": []
  },
  "gridPos": {
    "h": 11,
    "w": 12,
    "x": 0,
    "y": 3
  },
  "id": 82,
  "options": {
    "reduceOptions": {
      "values": false,
      "calcs": [
        "lastNotNull"
      ],
      "fields": ""
    },
    "orientation": "auto",
    "showThresholdLabels": false,
    "showThresholdMarkers": true,
    "sizing": "auto",
    "minVizWidth": 75,
    "minVizHeight": 75
  },
  "pluginVersion": "11.0.0-68547",
  "targets": [
    {
      "datasource": {
        "type": "prometheus",
        "uid": "grafanacloud-prom"
      },
      "editorMode": "code",
      "expr": "delta(guardian_heartbeats[$__interval])",
      "hide": true,
      "instant": false,
      "legendFormat": "__auto",
      "range": true,
      "refId": "A"
    },
    {
      "conditions": [
        {
          "evaluator": {
            "params": [
              0,
              0
            ],
            "type": "gt"
          },
          "query": {
            "params": []
          },
          "reducer": {
            "params": [],
            "type": "last"
          },
          "type": "query"
        }
      ],
      "datasource": {
        "name": "Expression",
        "type": "__expr__",
        "uid": "__expr__"
      },
      "expression": "A",
      "hide": true,
      "refId": "B",
      "type": "threshold"
    },
    {
      "datasource": {
        "name": "Expression",
        "type": "__expr__",
        "uid": "__expr__"
      },
      "expression": "B",
      "hide": true,
      "reducer": "mean",
      "refId": "C",
      "type": "reduce"
    },
    {
      "datasource": {
        "name": "Expression",
        "type": "__expr__",
        "uid": "__expr__"
      },
      "expression": "$C * 100",
      "hide": false,
      "refId": "D",
      "type": "math"
    }
  ],
  "title": "Guardian Uptime",
  "transformations": [
    {
      "id": "renameByRegex",
      "options": {
        "regex": ".*guardian=\"([^\"]+)\".*",
        "renamePattern": "$1"
      }
    }
  ],
  "type": "gauge"
}```

* Did you receive any errors in the Grafana UI or in related logs? If so, please tell us **exactly** what they were.
No data error. That's it

* Did you follow any online instructions? If so, what is the URL?
Couldn't find any help online
