Hi, I have problems using that plugin in combination with Nodered.
It wouldt be VERY helpful, if an easy example can be provided.
- What Grafana version and what operating system are you using?
logger=settings t=2023-07-20T09:47:18.285556648+02:00 level=info msg=“Starting Grafana” version=10.0.2
Add-on: Grafana
The open platform for beautiful analytics and monitoring
Add-on version: 9.0.2
You are running the latest version of this add-on.
System: Home Assistant OS 9.5 (aarch64 / raspberrypi4-64)
Home Assistant Core: 2023.3.3
Home Assistant Supervisor: 2023.07.1
- What are you trying to achieve?
I like to use the Data Manipulation plugin to communicate with Nodered
- How are you trying to achieve it?
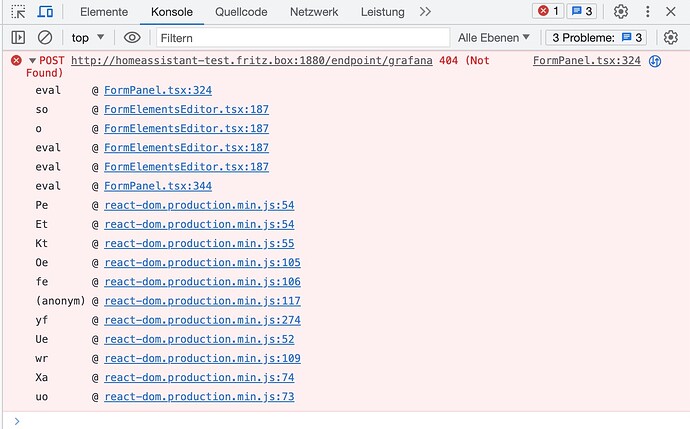
I tried to use an url like http://homeassistant-test.fritz.box:1880/endpoint/grafana with a POST request to address Nodered Node type “http in”
Getting no data in Nodered
- What did you expect to happen?
Getting data in Nodered at the /endpoint/grafana
-
Can you copy/paste the configuration(s) that you are having problems with?
-
Did you receive any errors in the Grafana UI or in related logs? If so, please tell us exactly what they were.
seeing 404 in Chrome console
- Did you follow any online instructions? If so, what is the URL?
http://homeassistant-test.fritz.box:1880/endpoint/grafana
1 Like
@guenterms Community members successfully used the Data Manipulation panel with node-red, and we have a blog draft for node-red. I will look into prioritizing it.
The error means that you are making POST requests to /endpoint/grafana, when in the node-red, I see only GET request configured. You need to add a POST request to accept updates.
Thank you!
I’m interested in the blog draft for node-red. Is it available?
In my understanding, the POST requests are generated from the Grafana plugin to address a “http in” node in node-red /endpoint/grafana when the button is pressed. But nothings arrives in node-red. Of course i have to answer a request with a http response WHEN the request arrives. But that’s the problem. Chrome still states 404.
Any idea how to get closer? Anyone has an example with node-red?
Thanx Guenni
I got it!!
You’re right, it must be POST, see screenshot
Another good hint is: Node-RED | Volkov Labs
Thank you!
@guenterms You are right. There is an excellent example in the documentation, which is not complete. I will look into updating it as well.
Hey Mikhail
just a quick (maybe even a stupid) question. Im new to IOT and working with grafana. I need to send data back from grafana to NODE-red. I think i understand most of the stuff but i can’t seem to link them both up by the URLs.
@mohammadbintila, you need to create a POST endpoint in the Node-RED. Check the screenshot above.
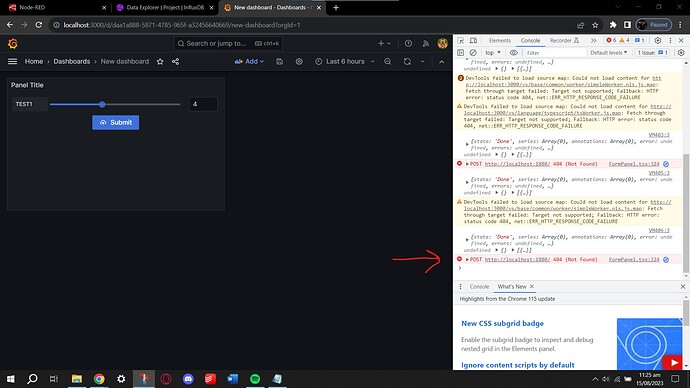
Data Manipulation can’t find the POST endpoint on the provided URL.
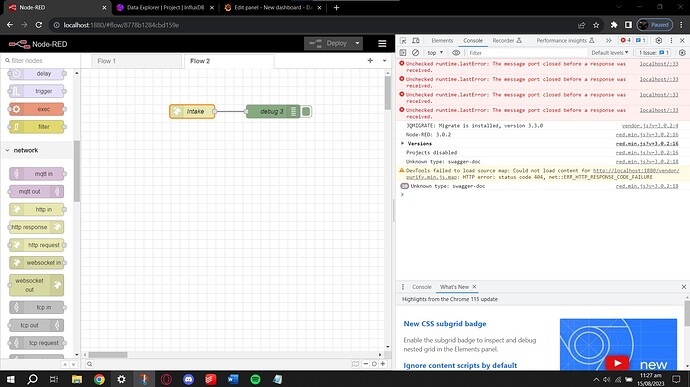
Have i not? i mean i did change the name to ‘intake’, but i choose method 'POST" and then specified the URL of my Grafana Dashboard.
Is that not how i was suppose to do it? and if not. then can you please guild me through it?


