Grafana Version:
grafana-server -v
Version 4.5.2 (commit: ec2b0fe)
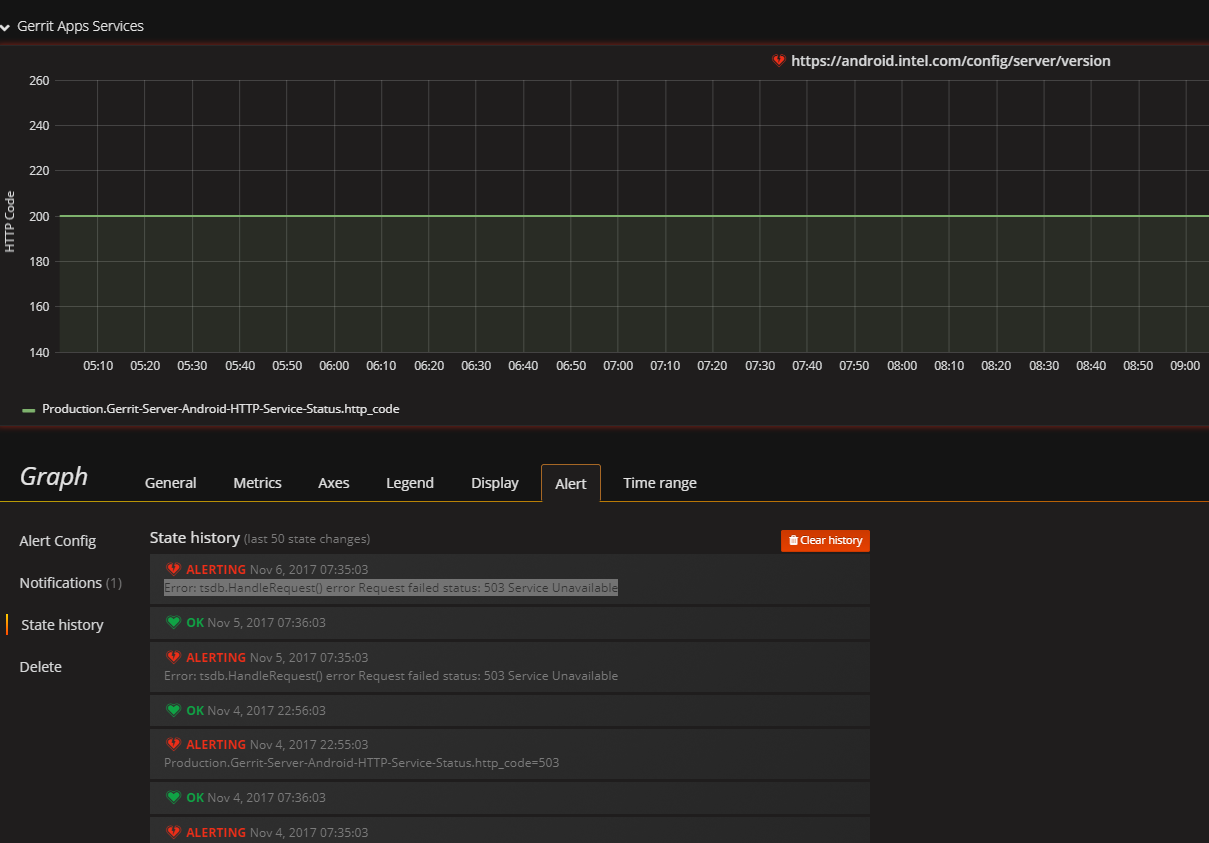
Found there are frequently/intermittently Grafana Handle Request Error trigger from my Graph when Alert option been configured. But why the handle not going to re-check again and change the status back when the handle is working to the graph? is it the Bug?
Error: tsdb.HandleRequest() error Request failed status: 503 Service Unavailable
I cannot find any error in the graphite log file, any idea? i did research
thru internet but cannot find any solution… can advise where i can check
on local host?
Hi Torkel,
Here is the error I can got from grafana log file, but I did saw these error logged everyday in grafana log files. With the error description and look like there is localhost apache services itself having the problem to when executed the grafana alert’s handler, is it? is this normal or known issues?
t=2017-11-07T07:35:03+0800 lvl=info msg=“Request failed” logger=tsdb.graphite status=“503 Service Unavailable” body="\n\n503 Service Unavailable\n\n
Service Unavailable
\n
The server is temporarily unable to service your\nrequest due to maintenance downtime or capacity\nproblems. Please try again later.
\n\nApache/2.4.18 (Ubuntu) Server at localhost Port 80\n\n"
t=2017-11-07T07:35:03+0800 lvl=eror msg=“Alert Rule Result Error” logger=alerting.evalHandler ruleId=12 name=“Gerrit ARM Devtools Server alert” error=“tsdb.HandleRequest() error Request failed status: 503 Service Unavailable” changing state to=alerting
t=2017-11-07T07:35:04+0800 lvl=info msg=“Request failed” logger=tsdb.graphite status=“503 Service Unavailable” body="\n\n503 Service Unavailable\n\n
Service Unavailable
\n
The server is temporarily unable to service your\nrequest due to maintenance downtime or capacity\nproblems. Please try again later.
\n\nApache/2.4.18 (Ubuntu) Server at localhost Port 80\n\n"
t=2017-11-07T07:35:04+0800 lvl=eror msg=“Alert Rule Result Error” logger=alerting.evalHandler ruleId=46 name=“https:// alert” error=“tsdb.HandleRequest() error Request failed status: 503 Service Unavailable” changing state to=alerting
Your query is likely overloading your graphite server, (or one its downstream servers), so that its not getting back to grafana before the timeout expires, hence your 503. You might want to have this query running while you are watching top or htop on your graphite server, and you are likely to see the graphite-web process pegging the CPU. At least this is what the issue is when I see this.
Hello,
I have found the solution to this problem,
Here is the solution in case someone comes across this problem
Apparently grafana renders graphs through through graphite web app running on apache
So, in my case my apache was down, all I had to do was to start the apache server