Please avoid posting in the Grafana parent category. Whenever possible choose a subcategory.
The email sends the result of test (fail/success).
And I want to monitor emails and count the fail/success rate with grafana.
I am really newbie here and quite lost with what to start.
Is there any angel to guide me?
If you give me any keyword I will try to search and study.
Which keywods should I search?
THANK YOU!!
~ the grafana team
grant2
2
Here is what I would do…
- Install Node-RED, Influx and Grafana on a Raspberry Pi (good how-to video here)
- Create a Node-RED flow to monitor the chosen email account and count the number of failed emails and overall number of sent emails.
- Use Node-RED to send the above to InfluxDB
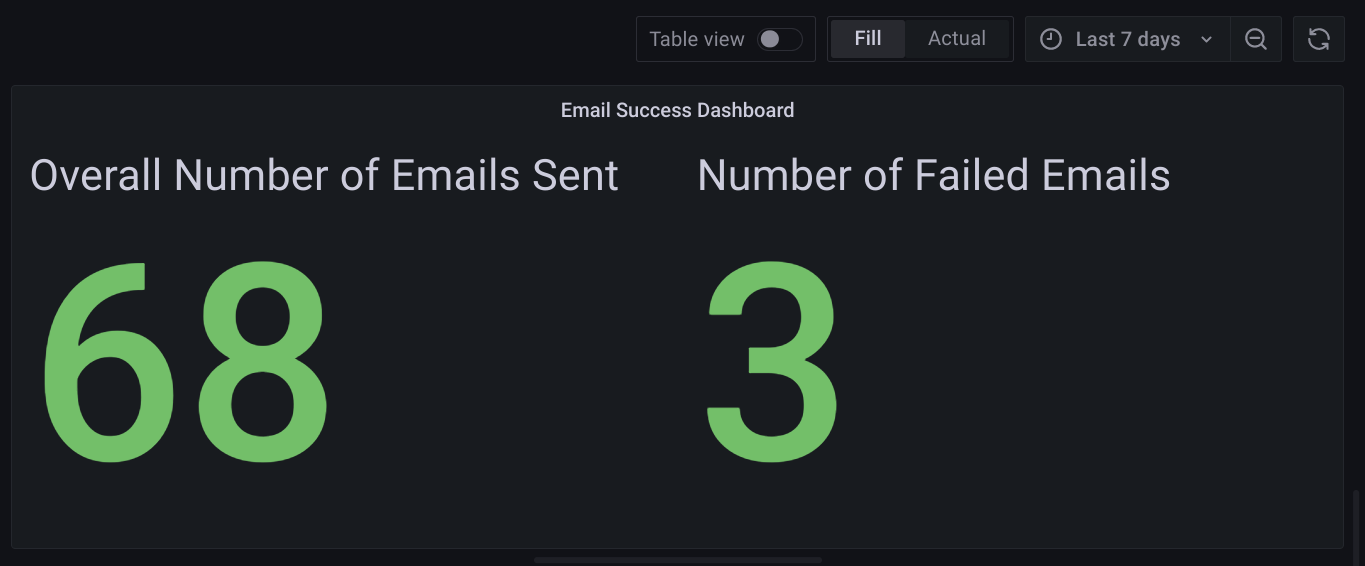
- Use Grafana Stat panel to query the selected set of data in InfluxDB
Result will be a Stat panel with 2 fields with a time selector.
Is that what you envision?
I really appreciate your kind and detailed reply
I only have window pc.
What would be the replacement of node red?
Node red can be installed on windows running node.js
https://nodered.org/docs/getting-started/windows
Then look for the email functionality on node red which can read an inbox
2 Likes
Oh my!
All of you are so amazing.
So thankful! I will try harrrrd to make it.
Super kind people 
1 Like
Another option is to use
python by itself or
python with telegraf to collect the email data into influxdb for example.
In fact do you have control over the process that aends the email notifications?
1 Like