Hey guys,
I’ve been stuck on this problem for a long time and I had put it aside to prioritize more important projects.
Working with Grafana 10.3, influxDB_V1 and Telegraf. I’m collecting data concerning my routers.
The base looks like:
time                agent_host board_temp cpu_frequency cpu_temp fan1_speed fan2_speed host hostname   memory_total memory_used network  sysUpTime voltage
----                ---------- ---------- ------------- -------- ---------- ---------- ---- --------   ------------ ----------- -------  --------- -------
1719298520000000000 10.211.0.9 250        1200          550      2581                  TIG  RB_OP_0009 983040       250560      backbone 38836584  276
1719298520000000000 10.211.0.8 340        1200          540      6768                  TIG  RB_OP_0008 983040       245120      backbone 28766740  274
1719298520000000000 10.211.0.7 300        1200          540      4092                  TIG  RB_OP_0007 983040       231872      backbone 448732    271
As you can see I fetch the IP and the hostname.
I made a variable that fetch IP from this base and another one that get the hostname of the routers depending of the IP:
SHOW TAG VALUES ON supervision FROM snmp WITH KEY = agent_host WHERE network =~ /^$network$/

SHOW TAG VALUES ON supervision FROM snmp WITH KEY = hostname WHERE agent_host =~ /^$routerIP$/
Where you can assume that the $network var is good and the routerIP var is returning IP address as it should. The hostname var is also returning the different hostname of my routers.
My problem is:
I’m trying to repeat a row in my dashboard trough the routerIP variable but display the name of the router. It should look like:

But with something like that I get the All value instead of my router name.

Even if I understand why I get the All value, I don’t see any solution for my problem.
Since the name of the router can change in the time, I can’t change my query to fetch data with a WHERE clause using the routerName instead of routerIP.
For now I’m repeating the row through the routerIP variable, but it’s not very simple to use with around 300 routers…
I’m open to any suggestion even workaround.
Best Regards
what is the relationship between the two variables?
Sorry I though it was clear.
This is the variable routerIP:
SHOW TAG VALUES ON supervision FROM snmp WITH KEY = agent_host WHERE network =~ /^$network$/
And this is the variable routerName:
SHOW TAG VALUES ON supervision FROM snmp WITH KEY = hostname WHERE agent_host =~ /^$routerIP$/
So I’m retrieving the name of my routers by identifying them using their IP.
you were clear, but how would grafana know what the relationship between the two variables are?
we know logically that a router must have an ip, but how would grafana know ip a belongs to router a, and ip b belogns to router b, they are two distinct lists to grafana…
I understand that, but since the routerName show results depending of the routerIP, I though it would be possible to use one for repeating while the other show the name that relate to each step of repetition.
Is it therefore impossible to repeat the value of the variable while displaying the name of another variable?
can you post a sanitized snip of your data and datasources, so i can see?
I’m collecting the data using the snmp plugin for Telegraf, everything goes into the same measurement snmp.
there’s an example of the measurement:
> select * from snmp order by time limit 10
name: snmp
time                agent_host  board_temp cpu_frequency cpu_temp fan1_speed fan2_speed host hostname   memory_total memory_used network  sysUpTime voltage
----                ----------  ---------- ------------- -------- ---------- ---------- ---- --------   ------------ ----------- -------  --------- -------
1719007210000000000 10.211.0.10 300        1200          540      4054                  TIG  RB_OP_0010 2031616      254528      backbone 26232668  272
1719007210000000000 10.211.0.11            1200          460      4350       4080       TIG  RB_OP_0011 1998848      333248      backbone 5791036
1719007210000000000 10.211.0.12 310        1200          530      5991                  TIG  RB_OP_0012 2031616      263552      backbone 32329159  270
1719007210000000000 10.211.0.13 310        1200          510      5115                  TIG  RB_OP_0013 2031616      248192      backbone 38544618  272
1719007210000000000 10.211.0.14 280        1200          530      4860                  TIG  RB_OP_0014 2031616      245952      backbone 38545172  270
1719007210000000000 10.211.0.15 250        1200          560      2763                  TIG  RB_OP_0015 983040       237248      backbone 38544629  276
1719007210000000000 10.211.0.16 260        1200          550      3218                  TIG  RB_OP_0016 983040       220992      backbone 50758     277
1719007210000000000 10.211.0.17 310        1200          560      5802                  TIG  RB_OP_0017 2031616      235264      backbone 1409456   272
1719007210000000000 10.211.0.18 330        1200          540      4596                  TIG  RB_OP_0018 2031616      250048      backbone 12612660  269
1719007210000000000 10.211.0.2  410        1200          580      8179                  TIG  RB_OP_0002 2031616      257216      backbone 20615660  267
and there’s the tags:
> show tag keys from snmp
name: snmp
tagKey
------
agent_host
host
hostname
network
The thing I really don’t understand is:
My variable routerName is dependent of the variable routerIP, in a way that if I setup the IP on All, I get all my router name:
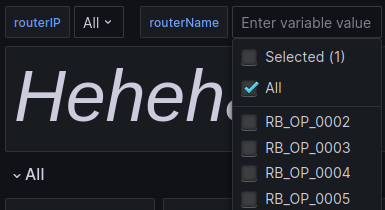
Which is supposed
And if I select a unique IP, I only get the name of this router:

So I don’t understand why the Grafana row don’t iterate trhough the content of the routerName variable instead of just displaying All.
If anyone have a good explanation… I’d take it! 
the two variables are not linked, so when you select the 1st variable, and it reaches out to the second variable, it takes the 1st value alphabetically (All), then select another value in the 1st variable, and again it will reach out to select the second variable, but it does not know to select the 2nd value of the 2nd variable, coz its only repeating on the 1st variable, so again, it picks the 1st value alphabetically from the 2nd variable, which again is All.
1 Like
read this post for something similar:
1 Like
Hey @sowdenraymond
Thanks for the explanation and the information.
Unfortunately since this is not in static configuration, I can’t really use the Custom Options. I’ve tried but I did not find a way to configure the option such as:
$routerIP(value1) : $routerName(value1), $routerIP(value2) : $routerName(value2) etc...
(This is an example)
Because if I only put the two variable and I repeat my row with my custom variable I just get all the content of the variable as a title.
Title: ${customVariable:label}
Repeat: $routerIP
I mean, I don’t get the All value, but still, it’s not really readable haha
I also understand why I get this result using the custom variable, but I didn’t another way to do that on the doc.
I’m okay with building an other routerName variable statically using the content of the routerIP variable.
A fully static solution would be to build a variable such as:

Then make the row repeat with this variable using the value of the var as a title:

And just used the variable ${funny:text} in the queries.
BUT this solution doesn’t really suit me since I have more than 70 routers to monitor and I’ll not put each address, and each name manually in my variable.
I’ve made a fully workaround solution which is quite heavy:
I’ve made a script which connect to my database to get all the IP and hostname, then it fetch the json dashboard using the Grafana API. With some magic it build a new one with the good variable with all the data (IP and hostname) and update the dashboard on Grafana.
I then just had to change the variable I used in my different queries, the repeat option, etc…
I don’t know if I should share the script, since it’s a very particular one and probably only suit my case… Let me know if someone is interested.
2 Likes
to share is to care. the more eyes on it the better the thing could get and help others
but that said the solution should be able to scale and not require manual tinkering
imagine suddenly you have 500 more routers will the solution work or trip up
so this is where automation comes in. can you create for ex a python script that reads datasources, routers, iot devices etc whatever xyz and push the data to a database that grafana and other systems can leverage.
indeed you shouldn’t. that intuitively tells you the need for automation, dump the values you need into a db, csv, json file whatever suits your need and knowledge base.skill sets and environment and point grafana to it
That’s exactly the point of my script, it actually connect to each router provided by a query which fetch all the IP from a database. Then get their name and build the json dashboard.
I’ll make it better before sharing it: actually it’s only about creating the variable, we should be able to modify it. Since it have more than 100 lines, should I just copy paste it here, or just link it to my git (for example)?
1 Like
There we are.
I’ve created a full GitHub repository for my script.
This script serves as an example of how to automate the construction of custom variables for Grafana. It’s intended more as a demonstration rather than a complete solution, so it may require some adaptation for your specific use case. Read it before just running it!
Since I’m not a dev, you may see some weird things in the code, don’t hesitate to give your feedback and I’m open to any suggestions for improvement.
Best regards
1 Like
looks nice. so you are rebuilding the whole dashboard and stuffing the content of FTTH_client_input into it? and if you are pushing the data to a txt file why not push it to a database then there wont be any need for you nice looking sh script
Well I guess my brain said “nah, just break your mind on a script, that’s better”.
For real, I just don’t really know how Grafana could build a Custom variable using the content of a Database or a csv file since there’s no datasource option for it.
And when I heard about that (thank to you), I was already advanced in the script. So I just finished it. Actually, we can use it for different purpose, with some change it’s really flexible…
I was some other project to finish, but I’ll go back on that later to find a solution using a variable connected to a specific datasource.
1 Like
so can you explain why you have a variable for routerip and routername? isnt there a 1:1 (one to one) routeip to routername relationship? seems redundant, but correct me if I am wrong
